
Core KPIs
- Active users, sessions & total queries
- Trend lines for growth, flat or decline
- Filter by team, role or date range
Up 24.8%
Features · Analytics & Intelligence
Bayaan's Analytics & Intelligence layer turns usage into visibility: core KPIs, model-wise breakdowns, daily activity and streaks, a full usage heatmap, and performance insights - all in one dashboard.
Why this page exists
Most organizations can tell you an AI tool was rolled out. Very few can tell you whether it is actually being used, by whom, for what, or whether that usage is translating into faster work. That gap is where AI budgets quietly stall - not because the tool failed, but because nobody could point to the evidence that it worked.
Bayaan closes that gap with a dedicated analytics layer built directly into the workspace: one dashboard that shows core adoption metrics, breaks usage down by model and by assistant capability, visualizes activity patterns over time, and turns all of it into insight an admin, a team lead, or an individual user can actually act on.
Analytics & Intelligence
Four powerful perspectives to understand usage, adoption, and engagement.
Why it matters
A dashboard full of vanity numbers does not help anyone make a decision. Core KPIs prove adoption is real, assistant and model-wise usage show where value is coming from, and daily activity with streaks turns usage into a habit instead of a one-time trial.
Activity heatmap
Spot patterns that matter. The Activity Heatmap shows when usage happens - which days, which hours, which teams - so you can see insights, not spreadsheets.
Visual, color-graded heatmap for instant pattern recognition.
Identify Monday peaks, quarterly surges, or drop-downs.
Understand how different teams or departments use Bayaan.
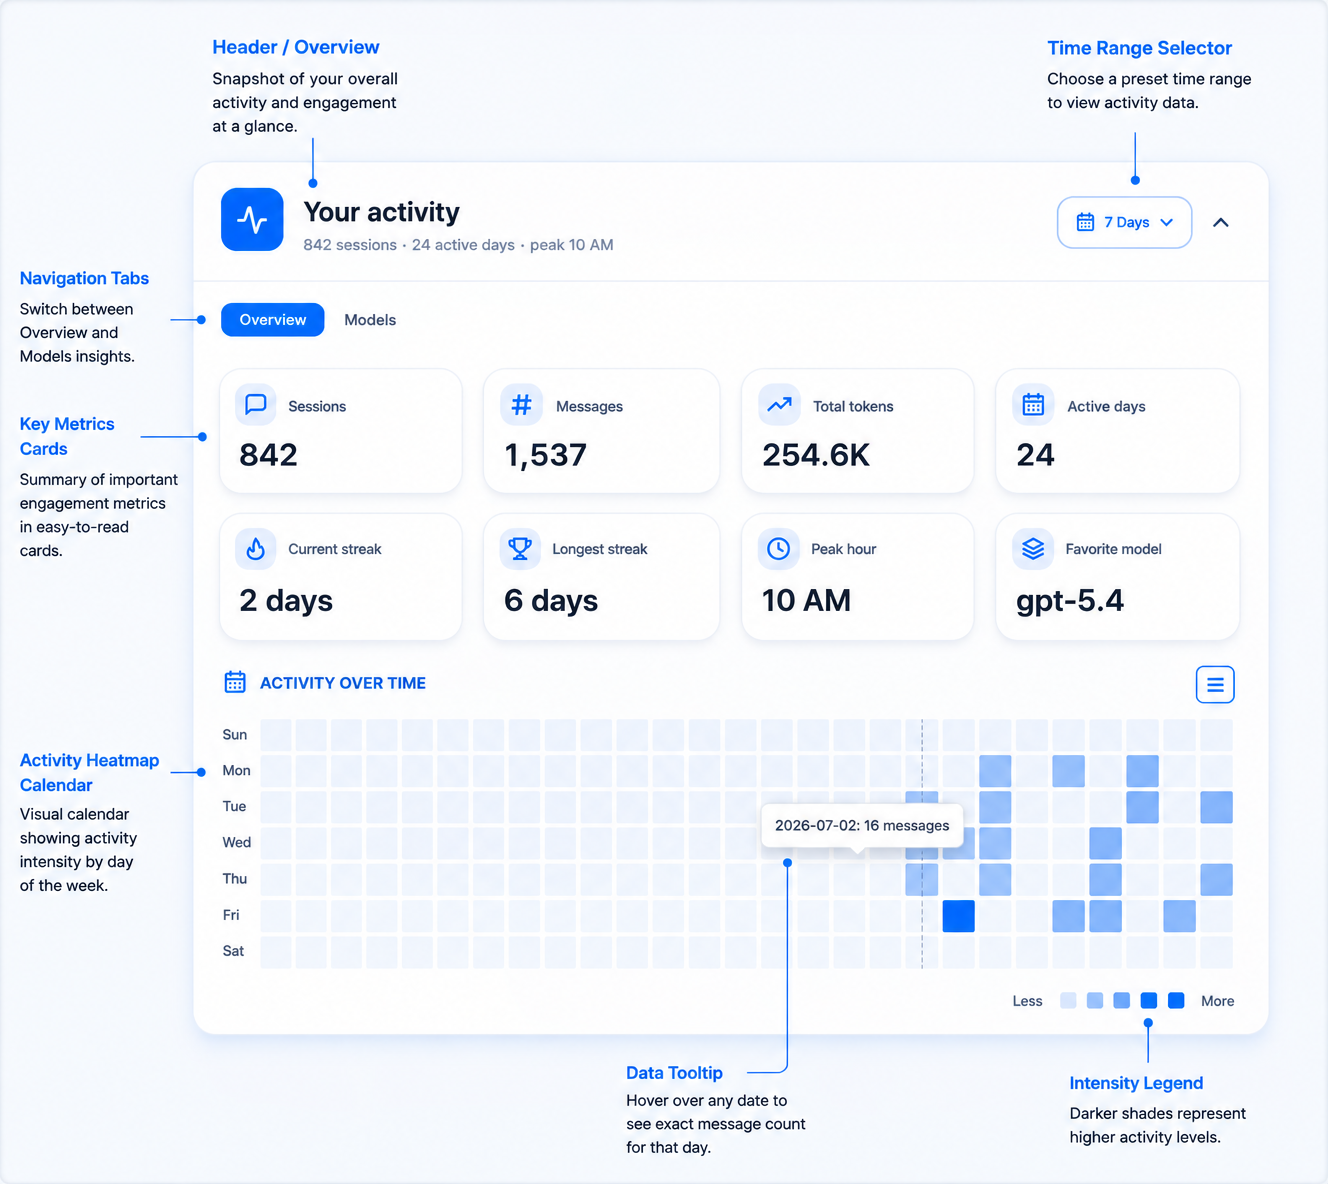 Activity intensityPeak hoursTeam patterns
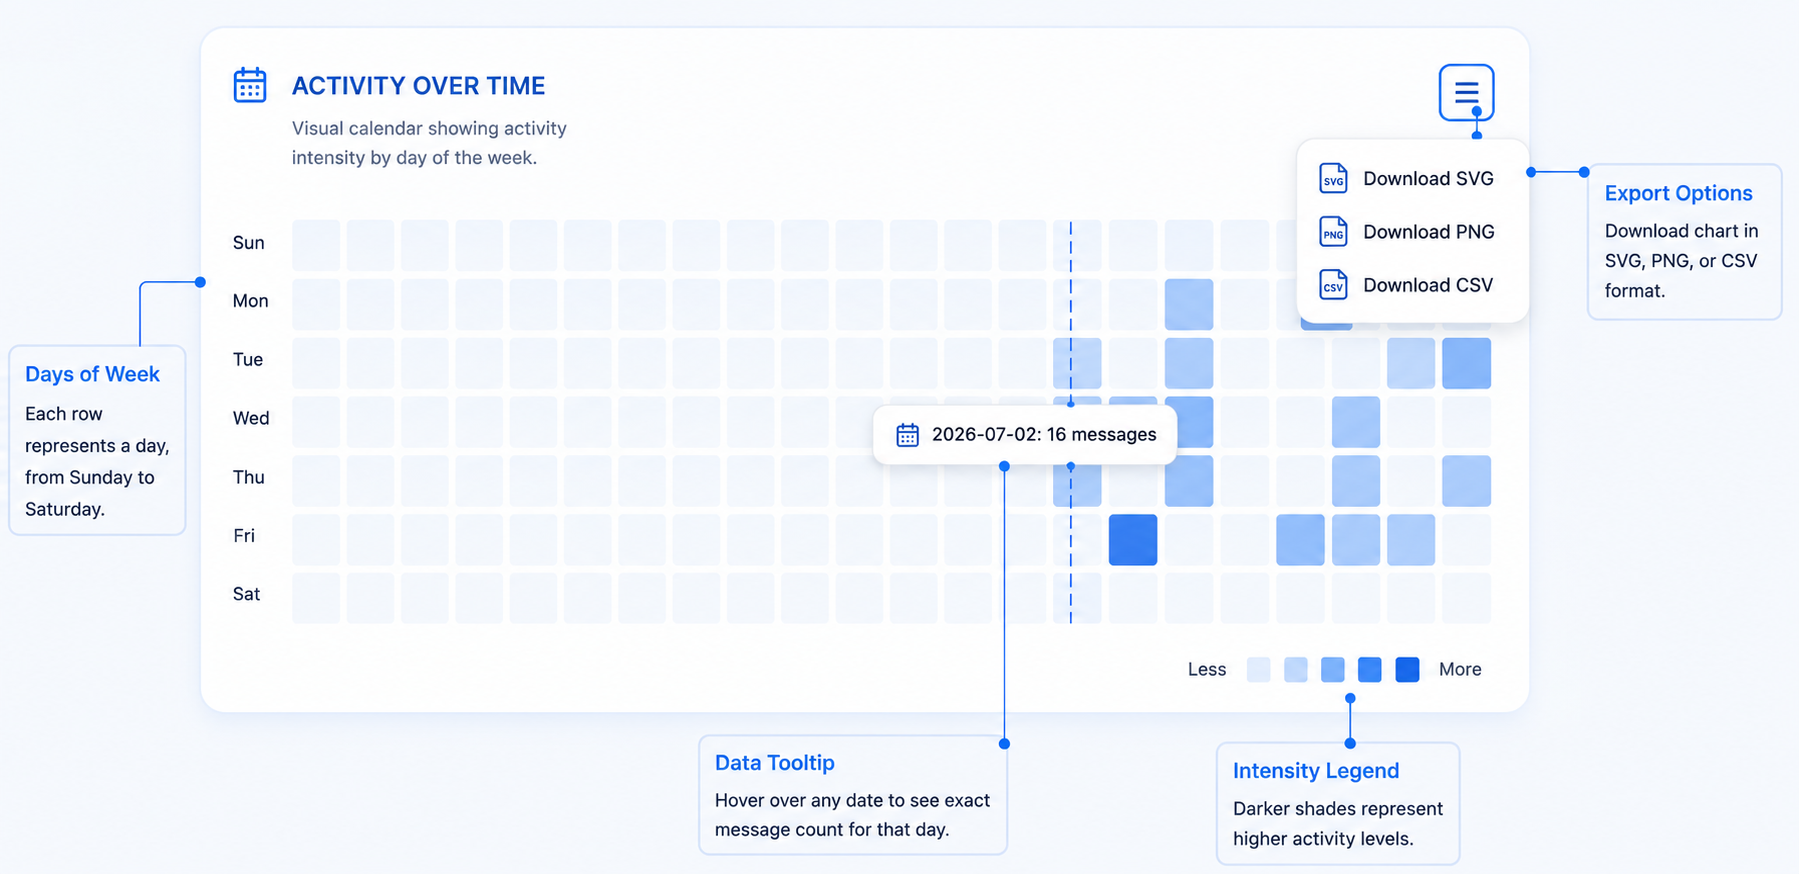 Data tooltipIntensity legend
Download heatmap
Analytics only matters if it can leave the dashboard and land in a report, board update, or QBR deck.
PNG, PDF, or CSV - ready for any report or presentation.
Change-management reporting, vendor reviews, or leadership updates.
Turn insights into slides with a follow-up prompt or export.
Performance insights
Performance Insights is where the dashboard stops being a report and starts being a decision-support tool - surfacing which models are earning their usage, and where overall adoption is heading.
A focused, model-centric view of performance shows which models get chosen most often, for which kinds of tasks, and how that mix shifts over time.
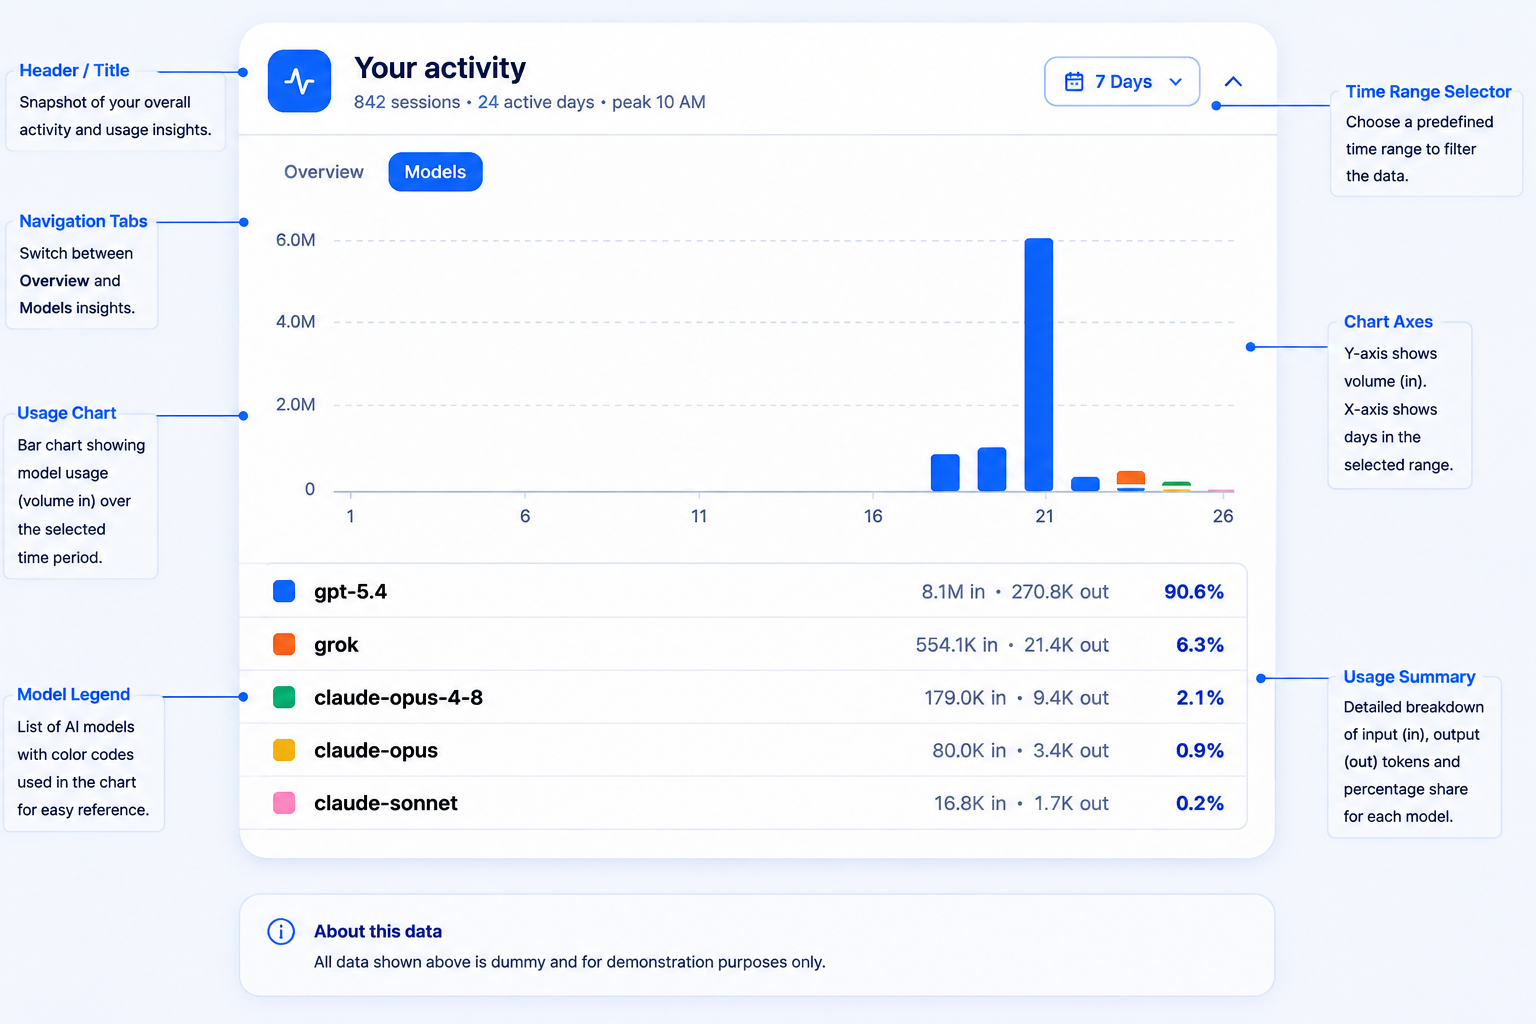 Header / TitleNavigation tabsUsage chartModel legendTime range selectorChart axesUsage summary
Overall assistant usage trends
Zooming out from any single model or capability, this view shows the trajectory of the whole workspace - whether adoption is accelerating, plateauing, or needs attention, across the organization or within a specific team or time period.
Connected intelligence
Across Ask Your Data, Generate Work, and Slash Commands feeds the same usage layer.
Turn that raw activity into something admins can act on and users can track.
Decide which models to keep enabled, which teams need onboarding support, and which access levels make sense.
Analytics vs. flying blind
Bayaan turns scattered signals into clear insights your team can act on.
Admins get organization-wide visibility across teams, models, and usage trends. Individual users see their own activity, including their daily activity view and streak, so the same dashboard supports both governance-level oversight and personal engagement tracking.
For teams researching who can see the analytics dashboard - is it only for admins, the practical priority is a clear connection between business context, trusted data, and an actionable result. Bayaan brings that context into a governed enterprise AI workspace so users can move from a natural language question to a useful answer with less manual work.
This approach supports stronger search visibility for enterprise AI, conversational analytics, and secure business automation while keeping the workflow focused on reviewable outcomes. Organizations can apply role based access, source aware answers, and repeatable processes as adoption grows across departments.
Core KPIs cover the fundamentals of adoption: active users, total queries or sessions, and how those numbers are trending over a selected time period. They are designed to answer the first question any admin or leader asks: is this actually being used.
For teams researching what counts as a core kpi on the dashboard, the practical priority is a clear connection between business context, trusted data, and an actionable result. Bayaan brings that context into a governed enterprise AI workspace so users can move from a natural language question to a useful answer with less manual work.
This approach supports stronger search visibility for enterprise AI, conversational analytics, and secure business automation while keeping the workflow focused on reviewable outcomes. Organizations can apply role based access, source aware answers, and repeatable processes as adoption grows across departments.
Yes. Core KPIs, assistant usage, and model-wise usage can all be filtered by team, role, or date range, so a manager can see their own team’s adoption without wading through company-wide numbers that are not relevant to them.
For teams researching can i see usage broken down by team or department, not just organization-wide, the practical priority is a clear connection between business context, trusted data, and an actionable result. Bayaan brings that context into a governed enterprise AI workspace so users can move from a natural language question to a useful answer with less manual work.
This approach supports stronger search visibility for enterprise AI, conversational analytics, and secure business automation while keeping the workflow focused on reviewable outcomes. Organizations can apply role based access, source aware answers, and repeatable processes as adoption grows across departments.
The streak counter tracks consecutive days of activity for an individual user, similar to a habit tracker. AI tools that get used once and forgotten do not deliver value, and a visible streak gives users a reason to build Bayaan into their daily workflow instead of their occasional one.
For teams researching what is the streak feature, and why does it matter, the practical priority is a clear connection between business context, trusted data, and an actionable result. Bayaan brings that context into a governed enterprise AI workspace so users can move from a natural language question to a useful answer with less manual work.
This approach supports stronger search visibility for enterprise AI, conversational analytics, and secure business automation while keeping the workflow focused on reviewable outcomes. Organizations can apply role based access, source aware answers, and repeatable processes as adoption grows across departments.
Yes. The activity heatmap can be downloaded directly and dropped into a report, board update, or QBR deck. Since Bayaan also generates decks and documents natively, an exported heatmap can become a slide in a governed, on-brand deck with one additional prompt.
For teams researching can i export the heatmap or other analytics for a report, the practical priority is a clear connection between business context, trusted data, and an actionable result. Bayaan brings that context into a governed enterprise AI workspace so users can move from a natural language question to a useful answer with less manual work.
This approach supports stronger search visibility for enterprise AI, conversational analytics, and secure business automation while keeping the workflow focused on reviewable outcomes. Organizations can apply role based access, source aware answers, and repeatable processes as adoption grows across departments.
Performance Insights shows which models are actually being used and for what kind of task, which is the evidence admins need to make governance decisions: which models to keep enabled, which to promote to specific teams, and where access should be adjusted.
For teams researching how does this connect to model selection and governance, the practical priority is a clear connection between business context, trusted data, and an actionable result. Bayaan brings that context into a governed enterprise AI workspace so users can move from a natural language question to a useful answer with less manual work.
This approach supports stronger search visibility for enterprise AI, conversational analytics, and secure business automation while keeping the workflow focused on reviewable outcomes. Organizations can apply role based access, source aware answers, and repeatable processes as adoption grows across departments.
Analytics & Intelligence
See core KPIs, model-wise usage, activity heatmaps, and performance insights running against your own team's real data.
Book a demo