

A portfolio-level NOI figure moves three percent in a quarter, and the real question is never the three percent. It is which properties, which leases, and which expense lines produced it. Across a twenty-asset portfolio, that answer has traditionally meant pulling exports from Yardi or MRI, reconciling them in Excel, and waiting on an analyst to build the bridge by hand.
AI shortens that path when it is connected to governed portfolio data. It can retrieve figures, compare them across properties and periods, and start narrowing a swing down to specific drivers in minutes rather than days. It cannot replace the judgment that decides what to do about the swing, and it cannot fix messy source data by itself.
In this article
- AI-assisted portfolio analysis works best as a sequence of five modes: retrieve, compare, decompose, diagnose, and deliver.
- Variance decomposition is where AI can save substantial analyst time by tracing a portfolio figure down to property, lease, or account level.
- Cohort and same-store comparisons depend on the firm's own inclusion rules.
- Anomaly detection surfaces outliers for review; it does not confirm the cause by itself.
- Scenario questions require explicit assumptions, not silent extrapolation.
- Output quality tracks source-system data quality directly.
What "analyzing a portfolio with AI" actually means
AI portfolio analysis is a natural-language or model-driven layer placed over connected CRE data sources such as rent rolls, general ledgers, budgets, and lease files. It lets a person ask a performance question and get an answer traced back to source records rather than a static report built for a different question.
Most CRE portfolios already have dashboards. What they often lack is a way to ask the follow-up question a dashboard was not built to answer: why did occupancy at one submarket cluster fall while the portfolio average held, or which three leases account for most of next quarter's expiration risk?
The complication is grain. A rent roll lives at the unit or lease level. A general ledger lives at the account and property level. A budget may use a different level than actuals. Any AI layer has to reconcile those grains correctly or it will produce an aggregate that looks clean and is quietly wrong.
Retrieve: getting a straight answer without a report request
The simplest mode is direct lookup: current occupancy at a named property, leases expiring in the next 90 days, or budget variance for a specific expense line. This is the mode that removes the queue. Instead of a request sitting in an analyst's inbox, the asset manager gets an answer with the source record attached.
Retrieval is also where grain mismatches show up first. "How many square feet are vacant?" depends on whether the system is counting physical vacancy, leased-but-not-occupied space, or another governed definition. A retrieval layer should state which definition it used.
Compare: setting numbers against a budget, a period, or a benchmark
| Comparison type | Example question | What has to be defined first |
|---|---|---|
| Budget vs. actual | Is Property A over budget on repairs and maintenance this quarter? | Consistent chart of accounts across properties |
| Period over period | How did average asking rent change year over year? | Matching unit of measure and reporting calendar |
| Cross-property benchmark | Which office assets have the highest expense ratio? | Normalized square footage and expense categorization |
| Same-store cohort | What is same-store NOI growth this quarter? | Explicit rules for acquisitions, dispositions, and major renovations |
Same-store analysis is a common source of disagreement because firms define inclusion differently. An AI layer should let the firm encode its own rule and apply it consistently.
Decompose: tracing a portfolio number to its drivers
This is where the time savings are largest. Consider a hypothetical twenty-property office portfolio with NOI down 3.1% versus budget. A decomposition query can attribute the swing to the properties driving the miss, then to revenue versus expense, and then to specific accounts such as elevated utilities or delayed lease-up.
The decomposition itself is mechanical. Deciding what to do about a utilities overage or stalled lease-up is not. That judgment remains with the asset manager.
Diagnose: anomaly triage and cross-metric patterns
Anomaly triage flags things worth a human look: an expense line above its trailing average, a concession rate jumping alongside leasing slowdown, or a CapEx draw that does not match the approved budget. The value is surfacing the right items for review, not declaring the cause.
Cross-metric diagnostics can connect patterns across data types, such as an occupancy decline alongside higher concessions and a slower leasing pipeline. That correlation is a starting point for investigation, not a finished explanation.
Scenario support: where AI helps and where it has to stop
Teams often ask "what if" questions: what happens to portfolio NOI if renewal rates drop by a stated percentage, or if a specific tenant vacates at lease expiration? AI can run that math when assumptions are explicit and visible. It should not quietly extrapolate historical trends and present that as a forecast.
Strong use cases versus weak use cases
| Strong fit | Weak fit |
|---|---|
| Retrieving a defined metric with a source citation | Forecasting rent growth or occupancy without stated assumptions |
| Decomposing a variance to account or lease level | Explaining market-level causes without external data |
| Flagging anomalies against a defined baseline | Interpreting unstructured lease clauses that have not been validated |
| Budget-vs-actual and period-over-period comparison | Applying a same-store rule the firm has not explicitly defined |
| Producing report-ready output from verified analysis | Making a deal-level or disposition judgment call |
The Five Analysis Modes framework
The five modes form a repeatable sequence: Retrieve establishes the baseline number. Compare sets it against a budget, period, or peer set. Decompose traces a movement to its source. Diagnose separates genuine issues from noise. Deliver turns the verified analysis into a document someone outside the analysis can use.
Retrieve → Compare → Decompose → Diagnose → Deliver
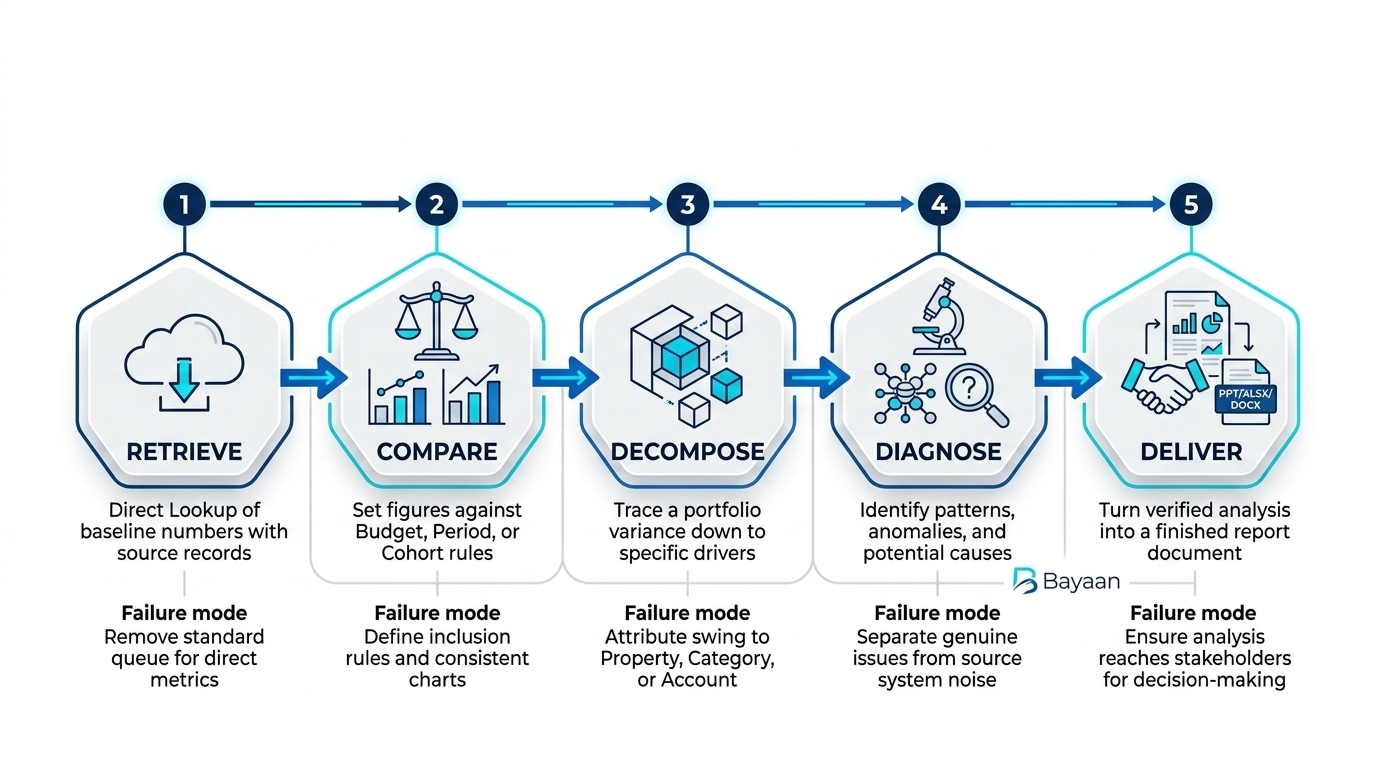
Skipping a step creates a predictable failure: skipping Compare removes context, skipping Decompose removes the cause, skipping Diagnose risks acting on noise, and skipping Deliver leaves the analysis trapped in one workflow instead of reaching decision-makers.
Where this falls short
- Grain mismatches produce quietly wrong aggregates. A rent roll, GL, and budget can operate at different grains, so joins must account for those differences.
- Same-store and occupancy definitions are not universal. AI applies the rule it is given; it does not know a firm's convention automatically.
- Unstructured lease terms need abstraction and validation first. Renewal options, co-tenancy clauses, and percentage-rent triggers usually require a governed abstraction process.
- Market judgment and forecasting sit outside the data. Competitor supply, tenant relationships, and negotiation context are not contained in portfolio transaction history.
How to evaluate this for your own portfolio
- Does it show the source record behind every number?
- Does it distinguish physical, leased, and economic occupancy explicitly?
- Can your team define its own same-store and cohort rules?
- Does it flag low-confidence extractions for review instead of guessing silently?
- Can a verified analysis move directly into a report format your team already uses?
- Does it state assumptions explicitly for forward-looking scenarios?
Run this checklist against a real recent variance your team already investigated manually. If the tool's decomposition matches what your analyst found by hand and shows its work at every step, it is ready for a wider pilot. If it produces a plausible-looking answer you cannot trace, treat that as a blocker.
How Bayaan supports AI-assisted portfolio analysis
Bayaan connects to governed CRE data, including rent rolls, general ledgers, and budgets, and returns answers with the source cited. A verified analysis can then be turned into PowerPoint or Excel output inside the customer's Azure environment. The useful pattern is a governed path from retrieve to diagnose to deliver, with the underlying source context preserved.
Turn portfolio questions into governed answers
See how Bayaan helps CRE teams connect governed business data, investigate portfolio questions, and generate trusted outputs.
Talk to Bayaan