

In this article
A commercial real estate team can spend millions on software and still struggle to answer simple portfolio questions.
Which assets contributed most to NOI decline this quarter?
Which lease expirations create the largest rollover exposure next year?
Which capital projects are driving variance against budget?
Which properties deserve executive attention first?
The problem is rarely a lack of data. Most portfolios already contain lease systems, financial systems, budget files, occupancy reports, rent rolls, capital-project data, and management reports.
The challenge is turning all of that information into timely analysis that decision-makers can actually use.
For years, many analytics initiatives focused primarily on dashboards. Dashboards remain valuable, but modern CRE organizations increasingly need additional capabilities: deeper drill-down analysis, ad hoc investigation, risk monitoring, governed access, executive self-service, and report-ready outputs.
That shift is changing how buyers evaluate commercial real estate analytics platforms.
This guide explains what modern analytics platforms should provide, which capabilities matter most, how asset managers and executives use them, and what organizations should evaluate before making technology investments.
Key takeaways
- Modern commercial real estate analytics platforms are designed to support investigation and decision-making, not just KPI monitoring.
- Portfolio analytics requires consistent definitions for NOI, occupancy, lease events, CapEx, and other core metrics.
- Asset managers, finance teams, leasing teams, and executives require different analytical workflows even when they use the same platform.
- Analytics platforms create the most value when users can move from a portfolio-level metric to supporting evidence quickly.
- Risk identification often depends on combining multiple signals rather than monitoring a single KPI.
- Executive self-service is only useful when metrics, definitions, permissions, and source transparency remain governed.
What is a commercial real estate analytics platform?
A commercial real estate analytics platform is a system used to analyze portfolio performance, investigate operational and financial changes, monitor risk, and support decision-making across assets, tenants, leases, budgets, and capital projects.
The category is broader than traditional reporting systems.
A modern analytics platform may help users:
- Monitor portfolio performance.
- Analyze NOI changes.
- Track occupancy and leasing activity.
- Investigate lease expirations.
- Review tenant concentration.
- Evaluate capital spending.
- Surface portfolio risks.
- Prepare management and investor reporting.
The defining characteristic is not visualization.
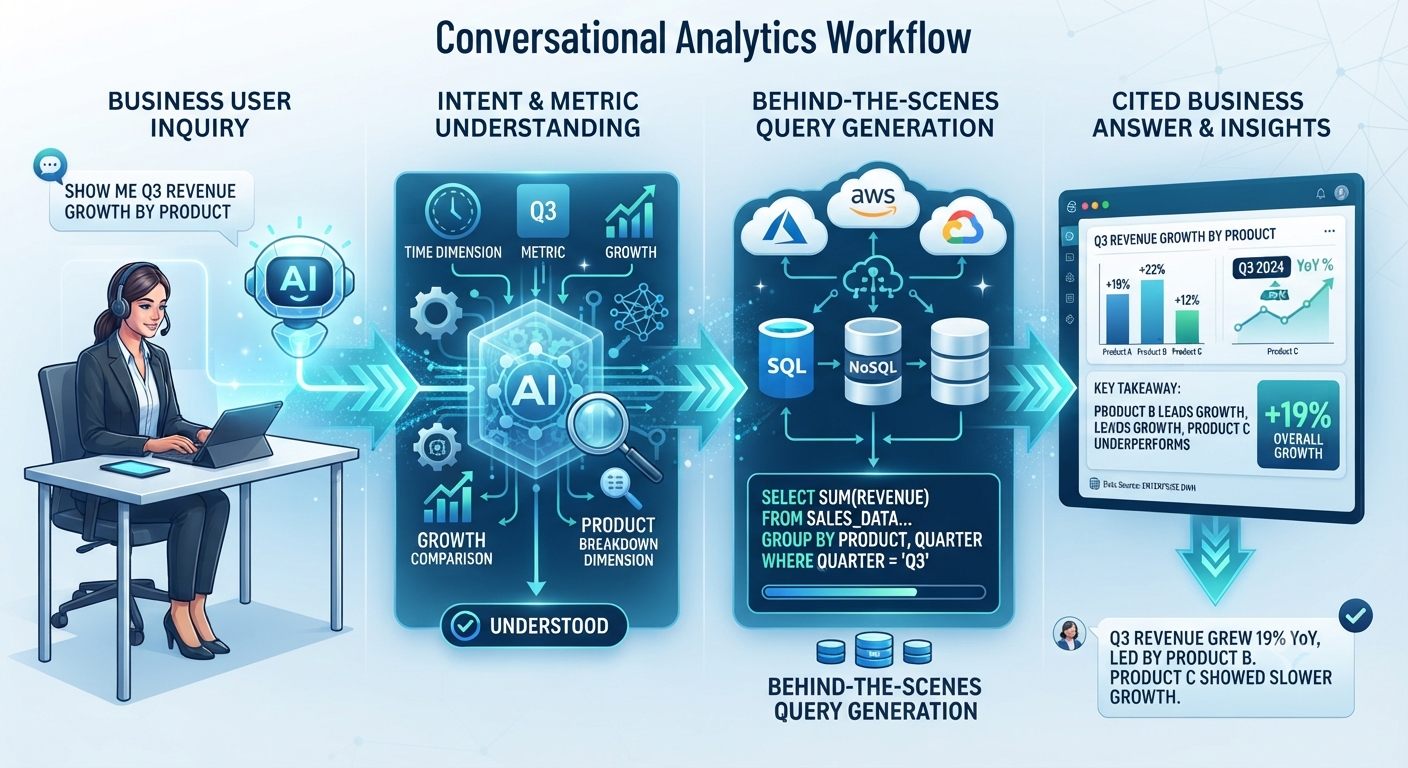
The defining characteristic is the ability to move efficiently from:
Question → Analysis → Evidence → Action
A dashboard may show occupancy declining.
An analytics platform should help explain why occupancy declined and identify which assets, leases, or tenants contributed to the change.
This difference becomes increasingly important as portfolios grow more complex.
Why dashboards alone are no longer enough
Dashboards solve a specific problem.
They provide visibility into predefined metrics.
That functionality remains valuable. Every mature portfolio should be able to monitor critical KPIs consistently.
However, dashboards are often less effective when users need answers to questions that were not anticipated when the dashboard was designed.
Consider the difference.
A dashboard may show:
- Occupancy: 91%
- Budget variance: -3.2%
- NOI change: -4.5%
Those metrics identify what happened.
Decision-makers often need additional information:
- Which assets drove the result?
- What changed?
- Which leases matter?
- Is the issue cyclical, operational, or one-time?
- What deserves immediate attention?
That second layer requires analysis rather than monitoring.
Modern analytics platforms increasingly focus on this deeper workflow.
For more on dashboard limitations, see:
- [[LINK: A36 — Commercial Real Estate Reporting: Why Static Dashboards Aren’t Enough]]
- [[LINK: A07 — AI Chatbot vs. BI Dashboard for Commercial Real Estate]]
What capabilities should a modern CRE analytics platform provide?
Many buyers evaluate platforms through feature lists.
A more useful approach evaluates analytical outcomes.
The strongest platforms generally provide six categories of capability.
Performance metrics
Every platform should support core portfolio metrics such as:
- NOI
- Occupancy
- Vacancy
- Leasing activity
- Budget performance
- Capital spending
These metrics provide the foundation for analysis.
Without consistency here, advanced capabilities become less valuable.
Drill-down analysis
Users should be able to move from:
Portfolio → Asset → Lease → Tenant → Supporting Data
without rebuilding reports manually.
Drill-down is often where analytical value emerges.
Ad hoc investigation
Many portfolio questions cannot be anticipated in advance.
Examples include:
- Which properties contributed most to occupancy decline?
- Which expense category drove NOI deterioration?
- Which lease events affected this quarter's results?
Analytics systems should support investigative workflows rather than only predefined reports.
Risk monitoring
Organizations increasingly expect analytics platforms to surface exposure related to:
- Tenant concentration
- Expiration clustering
- Occupancy deterioration
- CapEx variance
- Budget overruns
Risk visibility helps teams prioritize attention.
Delivery and reporting
Analysis eventually becomes work product.
Teams often need:
- Management reviews
- Asset-management reports
- Executive summaries
- Board presentations
- Investor communications
The most useful platforms support a smoother transition from analysis to reporting.
Governance
Analytics only becomes trusted when:
- Definitions are controlled.
- Permissions are enforced.
- Metrics are documented.
- Sources remain visible.
Governance is often less visible than dashboard features but more important to long-term adoption.
[[SME: Which capability generated the strongest stakeholder response during a Bayaan or ARC evaluation, what business problem did it address, and which portfolio data objects were involved?]]
The Modern CRE Analytics Stack
Analytics platforms are often evaluated as a single product category.
In practice, they operate across several layers.
The Modern CRE Analytics Stack
Metrics → Drill-down → Conversation → Risk Signals → Delivery → Governance
Each layer supports a different analytical need.
Layer 1: Metrics
Metrics establish the shared language of portfolio performance.
Examples include:
- NOI
- Occupancy
- Leasing activity
- Budget performance
- Capital expenditures
Without trusted metrics, higher-level analysis becomes unreliable.
Layer 2: Drill-down
Drill-down explains outcomes.
Examples:
- Which property drove NOI movement?
- Which tenant contributed to exposure?
- Which project created variance?
This layer transforms monitoring into investigation.
Layer 3: Conversation
Modern analytics increasingly includes conversational workflows.
Instead of creating a new report, users can ask questions directly and refine scope through follow-up analysis.
Examples:
- Compare this quarter to last quarter.
- Exclude disposed assets.
- Show only office properties.
- Focus on leases over 25,000 square feet.
Layer 4: Risk Signals
Analytics helps identify areas requiring review.
Signals may include:
- Rollover concentration
- Occupancy deterioration
- Budget variance
- Project overruns
- Tenant exposure
The goal is prioritization rather than prediction.
Layer 5: Delivery
Insights must become usable artifacts.
Examples:
- Executive summaries
- PowerPoint presentations
- Excel schedules
- Asset-management reports
This layer closes the gap between analysis and communication.
Layer 6: Governance
Governance supports every previous layer.
It includes:
- Definitions
- Permissions
- Ownership
- Lineage
- Auditability
Without governance, analytical adoption becomes difficult.
[[SME: Which layer of the Modern CRE Analytics Stack required the most organizational change before users trusted the analysis?]]
How different CRE teams use analytics platforms
The same platform often supports very different workflows.
Asset management
Asset managers focus on:
- Variance analysis
- Leasing performance
- Occupancy movement
- Expiration exposure
- CapEx oversight
Their workflow typically begins with a performance change and moves toward identifying the operational driver.
Finance and FP&A
Finance teams commonly use analytics for:
- Budget comparisons
- Forecast reviews
- NOI analysis
- Expense management
- Reporting preparation
Consistency is especially important because financial reporting depends on agreed definitions.
Leasing teams
Leasing teams often focus on:
- Vacancy
- Renewal exposure
- Pipeline activity
- Tenant concentration
- Space availability
Their requirements frequently combine operational and financial perspectives.
Executives
Executives usually need:
- High-level summaries
- Portfolio visibility
- Largest contributors
- Outliers
- Priority risks
The emphasis is often speed and clarity rather than detailed exploration.
Portfolio analysis requires more than KPIs
One misconception is that analytics platforms are simply collections of KPIs.
In reality, valuable portfolio analysis often depends on understanding relationships among metrics.
For example, a decline in NOI may relate to:
- Occupancy loss
- Tenant move-outs
- Increased operating expenses
- Delayed recoveries
- Project spending
Each explanation involves different datasets.
The strongest analytics environments help users connect those relationships rather than evaluating metrics in isolation.
This capability becomes increasingly important in larger portfolios where dozens or hundreds of assets contribute to aggregate performance.
For deeper portfolio-analysis workflows, see:
- [[LINK: A22 — Best Ways to Analyze a Commercial Real Estate Portfolio With AI]]
- [[LINK: A28 — Commercial Real Estate Portfolio Analysis: Metrics Every CRE Team Should Track]]
Portfolio analytics platforms are judged by how quickly they explain performance changes
Many software evaluations begin with metrics and dashboards.
The more revealing test is whether the platform can help users answer:
What changed, why did it change, and what should we look at next?
That progression separates reporting systems from true portfolio analytics environments.
Most commercial real estate teams analyze five major domains repeatedly:
- Financial performance
- Occupancy and leasing
- Lease expirations
- Capital spending
- Portfolio risk
Modern analytics platforms should support all five without requiring users to manually rebuild the analysis each time.
How analytics platforms support NOI analysis
Net Operating Income (NOI) remains one of the most important performance indicators in commercial real estate.
However, NOI analysis becomes difficult because the answer is rarely visible at the portfolio level.
A portfolio might show:
| Portfolio Metric | Result |
|---|---|
| Budget Variance | -3.8% |
| NOI Change | -4.2% |
| Revenue Change | -1.9% |
| Expense Change | +2.3% |
Those numbers identify a problem.
They do not identify the cause.
A useful analytics workflow typically allows users to:
- Identify overall variance.
- Isolate contributing assets.
- Segment by property type.
- Review revenue and expense contributors.
- Examine supporting account-level detail.
- Prepare a review-ready summary.
Without drill-down capability, analysts frequently create separate exports and spreadsheets to complete this process.
For deeper NOI analysis, see:
- [[LINK: A23 — Using AI to Analyze NOI Across a Commercial Real Estate Portfolio]]
[[SME: What NOI-related question appears most frequently during portfolio-review meetings, and which data sources are usually needed to answer it?]]
Occupancy and leasing analytics require precise definitions
One of the most common analytical mistakes in CRE is treating occupancy as a single metric.
Most organizations track several versions:
| Occupancy Type | Definition | Common Use |
|---|---|---|
| Physical Occupancy | Space physically occupied | Operations |
| Leased Occupancy | Space under lease | Asset management |
| Economic Occupancy | Revenue-producing occupancy | Finance |
Each metric answers a different question.
A platform that reports occupancy without specifying definitions can create confusion during management discussions.
Modern analytics environments should help users:
- Review occupancy trends.
- Analyze vacancy movement.
- Monitor lease-up activity.
- Compare property performance.
- Investigate leasing performance.
- Segment by market, property type, or ownership structure.
The most valuable capability is often diagnostic analysis rather than monitoring.
For example, a platform may reveal:
Occupancy declined 2%.
A stronger analytical experience reveals:
Occupancy declined 2% because three industrial properties experienced non-renewals totaling 118,000 square feet and no replacement tenants commenced during the quarter.
That level of detail supports decisions.
For deeper occupancy workflows, see:
- [[LINK: A24 — Using AI to Track Occupancy, Vacancy, and Leasing Performance]]
[[SME: Which occupancy definition causes the most confusion between teams, and how does the organization currently resolve those differences?]]
Lease expiration analytics helps teams understand rollover exposure
Lease expirations represent one of the most important forward-looking analytical categories in commercial real estate.
Most teams need visibility into:
- Upcoming expirations
- Renewal opportunities
- Concentration risk
- Exposure by property
- Exposure by tenant
- Exposure by market
Modern platforms should help users move beyond simple expiration schedules.
Useful analysis may include:
- Lease concentration by year.
- Tenant exposure by square footage.
- Exposure by annual revenue.
- Option windows.
- Notice-period monitoring.
- Concentrated rollover periods.
Analytics becomes particularly valuable when large portfolios contain thousands of leases.
Without analytical prioritization, teams frequently struggle to identify which expirations deserve immediate attention.
For deeper coverage of expiration analysis:
- [[LINK: A25 — How AI Can Identify Lease Expirations and Renewal Risk Across a Portfolio]]
Capital spending requires both financial and operational visibility
CapEx analytics differs from many other portfolio metrics because several versions of spending may exist simultaneously.
Examples include:
- Approved budget
- Committed spend
- Contracted amount
- Invoiced amount
- Actual spend
- Forecast completion cost
These values often appear similar while representing very different business realities.
A strong analytics platform helps users understand:
- Which projects are delayed.
- Which budgets are at risk.
- Where variance exists.
- Which assets drive overall portfolio exposure.
- Whether spending aligns with capital plans.
CapEx also benefits from roll-up and drill-down workflows.
Users may begin at a portfolio summary and then navigate through:
Portfolio → Property → Project → Cost Category
to isolate drivers behind variance.
For deeper CapEx workflows, see:
- [[LINK: A26 — Using AI to Analyze CapEx Budgets and Property-Level Spending]]
[[SME: Which CapEx metric proved most difficult to standardize across systems, and why?]]
Why risk analytics is becoming a core platform requirement
Risk analytics increasingly serves as the early-warning function of a portfolio.
Rather than waiting for financial results to deteriorate, organizations want earlier visibility into potential exposure.
Risk signals may relate to:
Tenant risks
- Concentration
- Large upcoming expirations
- Revenue dependency
Occupancy risks
- Vacancy growth
- Leasing slowdown
- Market underperformance
Financial risks
- NOI deterioration
- Budget variance
- Revenue concentration
Capital risks
- Project overruns
- Delayed completion
- Budget pressure
Data-quality risks
- Missing records
- Stale information
- Inconsistent reporting
A useful platform does not necessarily predict outcomes.
Instead, it helps users determine which issues deserve investigation first.
For deeper risk workflows:
- [[LINK: A27 — CRE Risk Analytics: Finding Tenant, Lease, Occupancy, and CapEx Risks Earlier]]
[[SME: What portfolio risk signal appeared simple to calculate but became valuable once monitored consistently?]]
Asset managers and executives need different analytical experiences
Many software evaluations assume every user interacts with analytics the same way.
That assumption is rarely true.
Asset manager workflow
Asset managers often ask:
- Which assets underperformed?
- Which tenants create exposure?
- Which projects require escalation?
- Which leases need attention?
Their workflow tends to involve:
Monitor → Investigate → Verify → Assign → Report
This is often a detailed analytical process requiring access to supporting evidence.
For deeper role-specific coverage:
- [[LINK: A29 — How Asset Managers Can Use AI to Analyze Commercial Real Estate Data]]
Executive workflow
Executives generally need a different experience.
Typical questions include:
- What changed?
- Why did it change?
- What requires immediate attention?
- Which assets matter most?
Executives usually prefer:
- Faster summaries
- Clear prioritization
- High-confidence results
- Efficient drill-down
The challenge is balancing speed with governance.
Executive self-service only works when definitions, permissions, and supporting evidence remain intact.
For deeper executive-specific workflows:
- [[LINK: A30 — How CRE Executives Can Get Portfolio Answers Without Waiting on Analysts]]
Analytics platforms increasingly combine recurring and ad hoc analysis
Traditional reporting focused on recurring metrics.
Modern analytics increasingly blends two modes:
| Analytical Mode | Purpose |
|---|---|
| Recurring Analysis | Track predefined KPIs |
| Ad Hoc Analysis | Investigate unexpected questions |
Examples:
Recurring
- Monthly NOI review
- Occupancy reports
- Budget performance
- Leasing summaries
Ad Hoc
- Why did occupancy decline?
- Which tenant drove revenue change?
- Which projects explain CapEx variance?
Many organizations still excel at recurring reporting but struggle with ad hoc investigation.
Modern analytics platforms are increasingly evaluated on how effectively they support both.
The best analytics platforms help teams move from insight to action
The strongest commercial real estate analytics platforms do more than identify trends.
They help organizations decide what to do next.
Unfortunately, many analytics projects stop after visualization.
Users receive dashboards, reports, and performance metrics but still depend on manual investigation to determine:
- What changed.
- Why the change occurred.
- Which assets require attention.
- What actions should follow.
A more mature analytics workflow connects:
Metric → Investigation → Evidence → Decision → Communication
This transition is often where organizations realize the greatest value.
For example, a portfolio review might identify a significant NOI decline.
The next steps frequently involve:
- Determining which properties contributed most to the decline.
- Identifying specific revenue or expense drivers.
- Reviewing occupancy and leasing impacts.
- Evaluating whether the issue is temporary or recurring.
- Communicating findings to leadership.
Strong analytics platforms reduce the effort required between each of those steps.
How analytics platforms support decision-making
Analytics systems are most valuable when they support recurring decisions.
Examples include:
Leasing decisions
Questions often include:
- Which properties require leasing attention?
- Which tenants create significant rollover exposure?
- Where is vacancy growing?
Capital allocation decisions
Questions often include:
- Which projects should receive funding priority?
- Which assets are consuming capital disproportionately?
- Which projects create the largest variance?
Asset-management decisions
Questions often include:
- Which properties underperformed expectations?
- Which revenue drivers changed?
- Which operating issues deserve escalation?
Executive decisions
Questions often include:
- What changed since the last review?
- Which assets require immediate attention?
- What risks should leadership discuss?
The ability to answer these questions consistently often matters more than producing another KPI.
Where this approach falls short
Commercial real estate analytics platforms create substantial value, but they also have limitations that buyers should understand clearly.
Source-system errors still drive outcomes
If lease records, occupancy data, financial systems, or CapEx information are incorrect, analytics outputs may also be incorrect.
Analytics cannot automatically repair unreliable source data.
Definitions remain an organizational challenge
Technology cannot resolve disagreements around:
- NOI
- Occupancy
- Renewal exposure
- CapEx categories
- Portfolio segmentation
Without governance, the same platform can still generate conflicting answers.
Risk signals are not predictions
Analytics can help identify exposure.
It should not be treated as a guarantee that future events will occur.
For example:
- A concentration risk is not automatically a tenant-default prediction.
- An upcoming expiration is not automatically a non-renewal.
- Budget variance is not automatically project failure.
Portfolio complexity creates interpretation challenges
Ownership structures, joint ventures, property types, and reporting methodologies can complicate analytical outputs.
Even the best analytics environments occasionally require manual review.
Executive summaries still need human judgment
Platforms can identify patterns and organize information.
They do not replace leadership decisions, investment strategy, tenant negotiations, or capital allocation discussions.
[[SME: Describe a situation where an analytical result was technically correct but still required significant business context before management could act on it.]]
Turn portfolio questions into governed answers
See how Bayaan helps CRE teams connect governed business data, investigate portfolio questions, and generate trusted outputs.
Talk to BayaanHow should a CRE team evaluate an analytics platform?
Software demonstrations often look similar.
Most platforms can display:
- Dashboards
- KPIs
- Charts
- Portfolio summaries
A stronger evaluation focuses on business outcomes.
Modern CRE Analytics Evaluation Checklist
| Evaluation Area | Question |
|---|---|
| Metrics | Are critical portfolio metrics governed consistently? |
| Drill-down | Can users investigate performance changes quickly? |
| Ad Hoc Analysis | Can unexpected questions be answered efficiently? |
| Risk Visibility | Does the platform support prioritization and review? |
| Reporting | Can analysis become real deliverables? |
| Accessibility | Can different user roles obtain relevant insights? |
| Governance | Are permissions and definitions controlled? |
| Scalability | Can the platform grow with the portfolio? |
| Transparency | Can users understand how results were generated? |
The strongest platforms typically perform well across all categories rather than excelling in only one area.
Buyer questions worth asking
Before selecting a platform, consider asking:
- How are portfolio metrics defined and governed?
- How does the platform support drill-down analysis?
- What investigative workflows exist beyond dashboards?
- How are leasing, occupancy, NOI, and CapEx connected?
- How are executive summaries produced?
- How are permissions enforced?
- How does the platform support reporting workflows?
- What happens when source records conflict?
The answers often reveal more than a feature checklist.
[[SME: During real buyer evaluations, which question most effectively separated enterprise analytics platforms from basic reporting tools?]]