
In this article
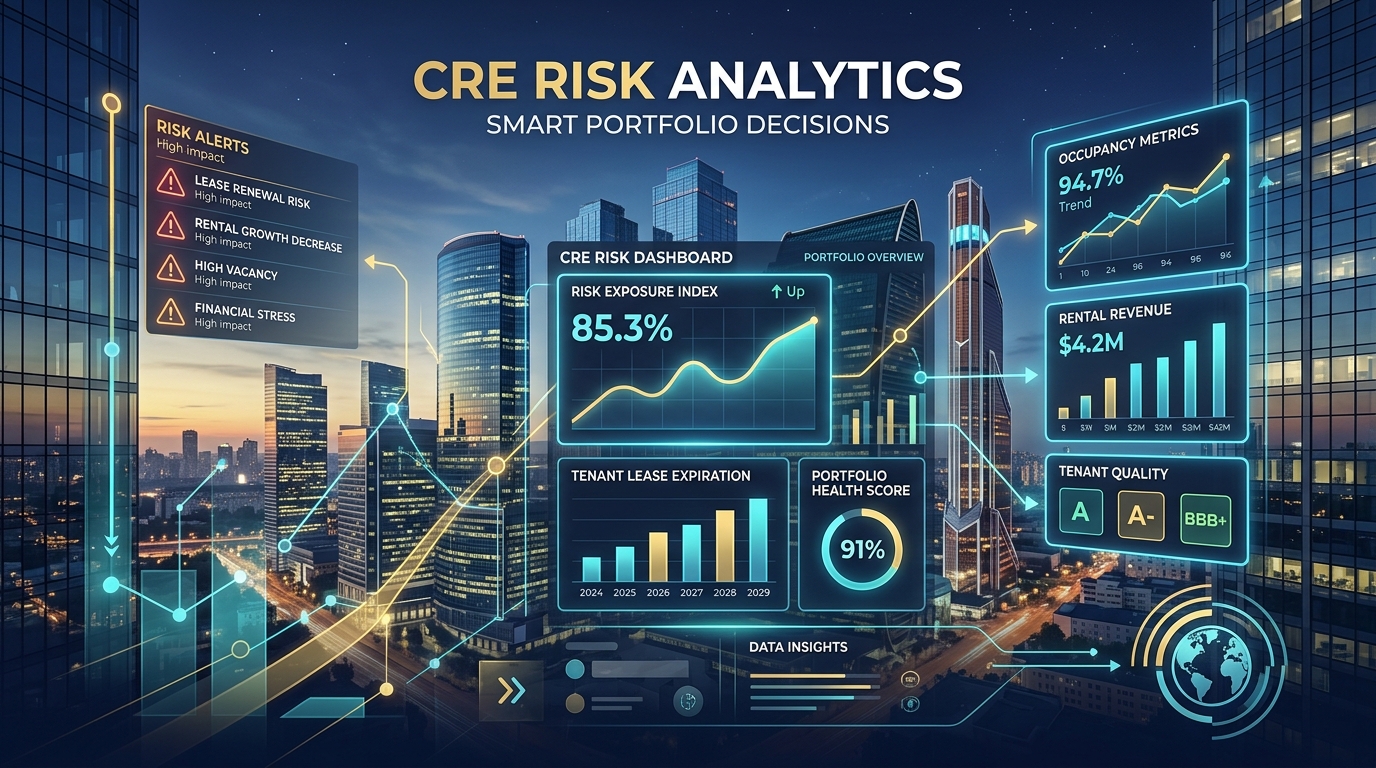
By the time a lease renewal falls through, the warning signs were usually visible for months: a rollover date landing next to two others in the same building, a CapEx project quietly drifting past budget, occupancy holding flat for longer than it should. Risk analytics in commercial real estate isn't about predicting which of those signals turns into an actual loss. It's about surfacing the combination early enough that someone with judgment can look at it before it becomes a surprise in a quarterly review. This article works through where risk signals originate across tenant, lease, occupancy, and CapEx data, how AI can help triage them at portfolio scale as part of a broader [[LINK: commercial real estate analytics platform -> A21]], and where the line sits between an early warning and a forecast the data can't actually support. It closes with a signal matrix and a triage workflow you can apply to your own portfolio.
Key takeaways
- Risk analytics in CRE works best as a structured way to flag exceptions for human review, not as a system that predicts tenant defaults, vacancies, or budget overruns.
- The most useful risk signals usually compound across domains — a rollover date, a tenant concentration issue, and a stalled leasing pipeline at the same property carry more weight together than any one alone.
- Tenant concentration risk isn't only about a single large tenant; it also includes multiple leases under related ownership or a cluster of tenants in one industry that could face a shared downturn together.
- Rollover clustering — several leases expiring in the same window at the same property — creates cash-flow exposure even when each lease individually looks fine.
- A CapEx forecast quietly drifting past budget is often one of the earliest signals of a property heading toward trouble, well before occupancy or NOI show it.
- Data-quality gaps, such as missing lease data or stale rent rolls, are themselves a risk category, because a system can't flag what it can't see.
What CRE Risk Analytics Means, and What It Doesn't
CRE risk analytics is the structured process of surfacing portfolio conditions — tenant concentration, lease rollover timing, occupancy trends, and CapEx variance — that indicate elevated exposure, so an asset manager or risk team can review them before they compound into a larger problem.
It's worth being precise about what that is not. Risk analytics is not a prediction that a specific tenant will default, that a specific lease won't renew, or that a specific project will go over budget. It's a way of organizing known facts — an expiring lease, a growing tenant concentration, a rising forecast — into a ranked list of things worth a closer look. The distinction matters because treating a risk signal as a forecast leads to two failure modes: overreacting to a flagged property that turns out fine, and underreacting once a real signal gets dismissed as noise from an algorithm.
A useful CRE risk analytics practice sits alongside the metric-specific work covered elsewhere: [[LINK: NOI variance analysis -> A23]], [[LINK: occupancy and leasing performance tracking -> A24]], [[LINK: lease expiration and renewal risk -> A25]], and [[LINK: CapEx budget analysis -> A26]] each produce their own signals. Risk analytics is the layer that looks across those domains at once, because the properties that actually need attention are usually the ones where two or three signals land in the same place, not the ones with a single metric slightly off trend.
The Domains Where CRE Risk Signals Originate
Portfolio risk in CRE surfaces from five recurring domains. None of them is unique to AI-assisted analysis, but AI changes how quickly a team can scan for them across a full portfolio instead of one property at a time.
Tenant concentration. A single large tenant occupying a disproportionate share of a property's square footage or rental income is the most obvious version, but concentration also shows up more subtly: several tenants under common ownership, or a cluster of leases in the same industry that could face a shared downturn together.
Rollover clustering. Multiple leases expiring within the same window at the same property create cash-flow exposure even when every individual lease looks healthy. A 10% vacancy risk on one lease is manageable; three leases representing 40% of the building expiring within six months of each other is a different kind of exposure.
Occupancy deterioration. A gradual decline in physical, leased, or economic occupancy, tracked over several periods rather than a single snapshot, often precedes a more visible problem. The trend line matters more than any single period's number.
Budget and CapEx variance. A capital project whose forecast is drifting past its original budget, especially early in the project's timeline, is frequently an earlier signal of asset-level trouble than occupancy or NOI, because it reflects field conditions before they show up in cash flow.
Data-quality risk. Missing lease data, stale rent rolls, or unreconciled general ledger entries aren't just operational annoyances. They're a risk category in their own right, because a portfolio review built on incomplete data will miss the properties that need it most.
[[SME: What data object does a rollover-concentration scan actually query — the rent roll, the lease expiration table, or a derived view — and how fresh is that data typically at the time someone reviews it?]]
Covenant and obligation signals, where the data exists, round out the list: financial covenant thresholds, insurance or reporting obligations tied to a loan agreement, or renewal-option deadlines that require action rather than passive tracking. [[VERIFY: confirm whether Bayaan currently surfaces loan covenant data as a distinct signal type, or whether this remains a roadmap capability]]
How Signals Compound Across Domains
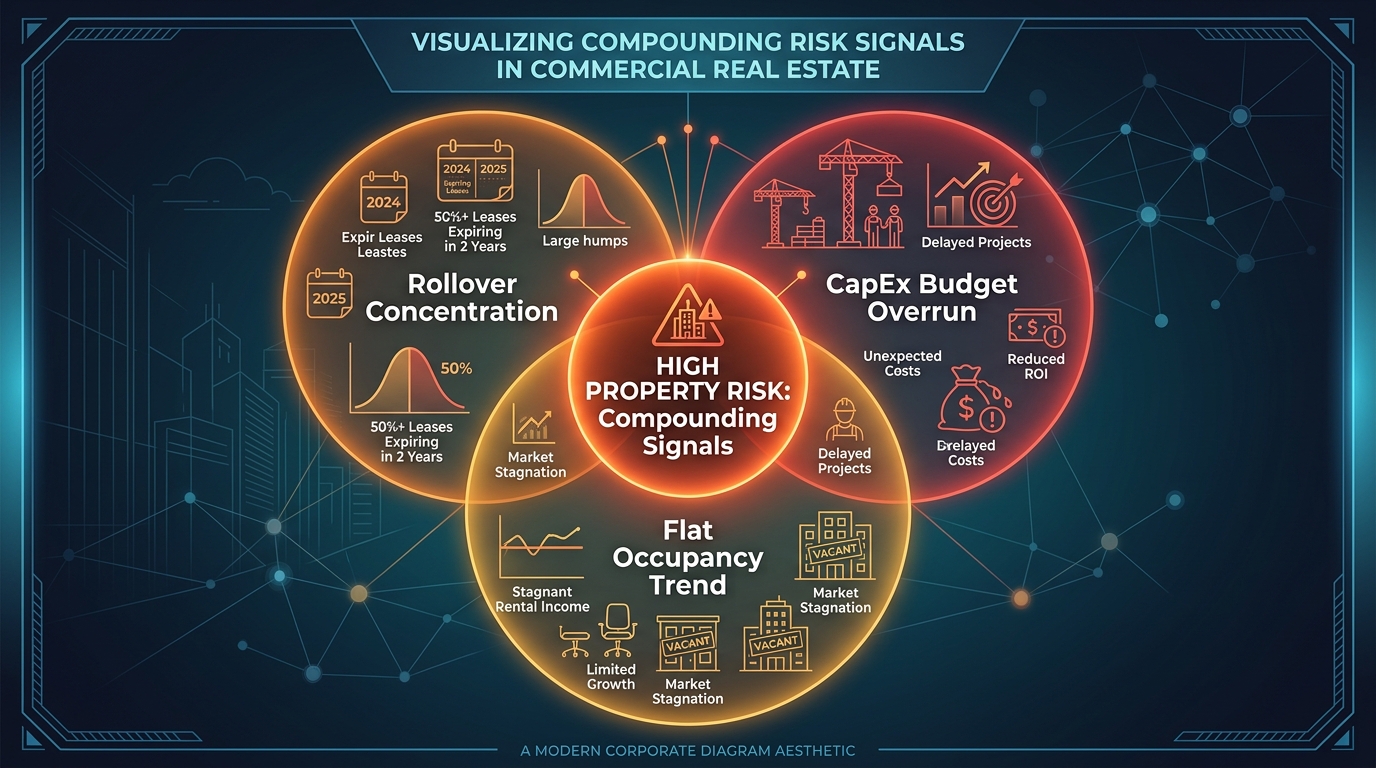
A single flagged signal rarely justifies escalation on its own. The signals worth immediate attention are usually the ones that compound.
Take a hypothetical mid-size office property. On its own, a 15% rollover in the next two quarters is unremarkable; most portfolios carry some near-term rollover at any given time. On its own, a CapEx forecast running 8% over budget on a lobby renovation is worth monitoring but not alarming. On its own, occupancy holding flat for three quarters isn't a red flag.
Put those three signals on the same property, though, and the picture changes. Rollover exposure means the property has less leasing-pipeline cushion to absorb tenant loss. A CapEx overrun means less capital flexibility to reposition space if a rollover doesn't renew. Flat occupancy over several quarters means the leasing team hasn't been closing new deals fast enough to offset the tenants who do turn over. None of the three signals predicts an outcome. Together, they identify a property with less room to absorb a bad renewal decision than it would have elsewhere in the portfolio.
[[SME: What's a real example of two or three signals that looked like compounding risk but turned out to share a single root cause once someone investigated?]]
That's the practical case for cross-domain risk analytics over single-metric dashboards: a dashboard built around one KPI at a time shows three separate charts, each within a normal range, and never surfaces the property where all three overlap.
Leading Indicators vs. Predictions
The distinction between a leading indicator and a prediction is not academic. It determines how a risk signal should be used, and misusing it is one of the more common ways AI-assisted risk analytics goes wrong.
A leading indicator is a fact about the present that historically correlates with future problems: rollover concentration, a widening CapEx variance, a declining occupancy trend. It describes a condition that exists right now, verifiable against source data, and it says nothing on its own about what will happen next. A prediction is a claim about a future outcome, usually inferred from a model, and CRE outcomes generally depend on variables an internal portfolio dataset doesn't capture: local market absorption, a specific tenant's financial health, a competitor's pricing decisions.
An assistant surfacing "three leases expire within 90 days at this property, and a CapEx forecast has moved 12% past budget" is reporting leading indicators grounded in data it can see. An assistant claiming a property has a stated percentage chance of losing a tenant is making a prediction the underlying data usually can't support, unless a firm has built and validated a model specifically for that purpose, with enough historical outcomes to calibrate it.
The practical rule: treat AI-surfaced risk signals as a prioritized list of what deserves a closer look, not as a probability estimate of what will happen.
The CRE Risk Signal Matrix
Turning scattered signals into something a risk or asset-management team can actually act on requires structure. The CRE Risk Signal Matrix organizes any signal into five fields: what it is, the rule that triggers it, the evidence behind it, who owns the follow-up, and when it gets reviewed again.
| Field | What it captures | Example |
|---|---|---|
| Signal | The condition being tracked | Rollover concentration at a single property |
| Threshold/Rule | The rule that triggers a flag | More than 25% of rentable square footage expiring within two quarters |
| Evidence | The underlying data supporting the signal | Rent roll, lease expiration dates, current leasing-pipeline status |
| Owner | Who is responsible for reviewing it | Asset manager assigned to the property |
| Next review | When the signal gets reassessed | Monthly until rollover resolves or the leasing pipeline changes |
The matrix works the same way across tenant concentration, occupancy deterioration, CapEx variance, and data-quality gaps; only the signal, threshold, and evidence columns change. What stays constant is the discipline of assigning an owner and a review date to every flagged item, so a signal doesn't sit unattended in a dashboard after the first time someone notices it.
Applied at the portfolio level, the matrix also doubles as a triage queue: sort every open signal by how many domains it touches and how close its threshold is to being breached, and the properties needing the closest attention this cycle surface without a manual, property-by-property review.
[[SME: In a live CRE risk-analytics deployment, what threshold or rule caused the most false positives before it was tuned, and what was adjusted?]]
Where This Falls Short
CRE risk analytics has real boundaries, and treating flagged signals as more certain than they are undermines the whole practice.
Thresholds are firm-specific, and generic ones produce noise. A rollover-concentration threshold that makes sense for a single-tenant industrial portfolio is different from one that fits a multi-tenant office portfolio. Applying an out-of-the-box threshold across a mixed portfolio will either flag too much or miss what actually matters.
[[SME: What's a real example of a risk threshold that had to be customized per property type or fund before it produced useful flags instead of noise?]]
Compounding signals can share a root cause without meaning the risk is worse. Three signals at one property might all trace back to a single delayed capital project, not three independent problems. Treating them as three separate risk factors overstates the property's actual exposure.
Market and tenant-specific context sits outside most internal datasets. A rollover-concentration flag says nothing about whether the market has strong replacement demand or whether the expiring tenant has already signaled renewal intent informally. That context still requires a human conversation, not a data query.
Data-quality risk can hide inside a risk report itself. A property with genuinely elevated risk but incomplete data may show fewer flags than a property with good data and moderate risk, simply because there's less to query. A clean-looking risk report isn't the same as a low-risk property.
Turn portfolio questions into governed answers
See how Bayaan helps CRE teams connect governed business data, investigate portfolio questions, and generate trusted outputs.
Talk to BayaanA Portfolio Risk Triage Workflow
Turning a list of flagged signals into a working review cycle usually follows a consistent sequence, whether it's run manually or assisted by AI.
- Scan the portfolio against defined thresholds. Pull every property where a signal — rollover, concentration, occupancy trend, CapEx variance, data gap — crosses its defined rule.
- Rank by compounding signals, not signal count alone. A property with two related signals, such as rollover plus low leasing-pipeline activity, usually deserves more attention than a property with two unrelated signals that happen to coincide.
- Pull the evidence behind each flagged signal. Before escalating, confirm the underlying data: the actual lease expiration dates, the current CapEx forecast, the leasing-pipeline status. A signal built on stale data isn't worth acting on until the data is current.
- Assign an owner and a review cadence. Every flagged property needs someone responsible for it and a defined point at which it gets reassessed, not an open-ended flag that sits until someone happens to notice it again.
- Close the loop. Once a signal resolves, whether a lease renews, a CapEx forecast comes back in line, or occupancy stabilizes, record what happened. That history is what eventually lets a firm calibrate its own thresholds instead of relying on generic ones.
[[SME: How does the triage workflow assign an owner to a flagged signal today — is that automatic based on property assignment, or does someone route it manually?]]
AI accelerates steps one and three: scanning a full portfolio against defined thresholds and pulling supporting evidence both happen faster than a manual review. Steps two, four, and five still depend on judgment and ownership that the system can support but not replace.