

In this article
Most portfolio risk is not a surprise. It is a signal that sat in a rent roll, a budget variance report, or a lease abstract for weeks before anyone connected it to the asset next to it. An anchor tenant's option window opens quietly. A submarket's vacancy creeps up two quarters in a row. A CapEx line runs over budget on a project that was already tight. None of these events is dramatic on its own, which is why they tend to surface only when a review looks at more than one at once on the same property.
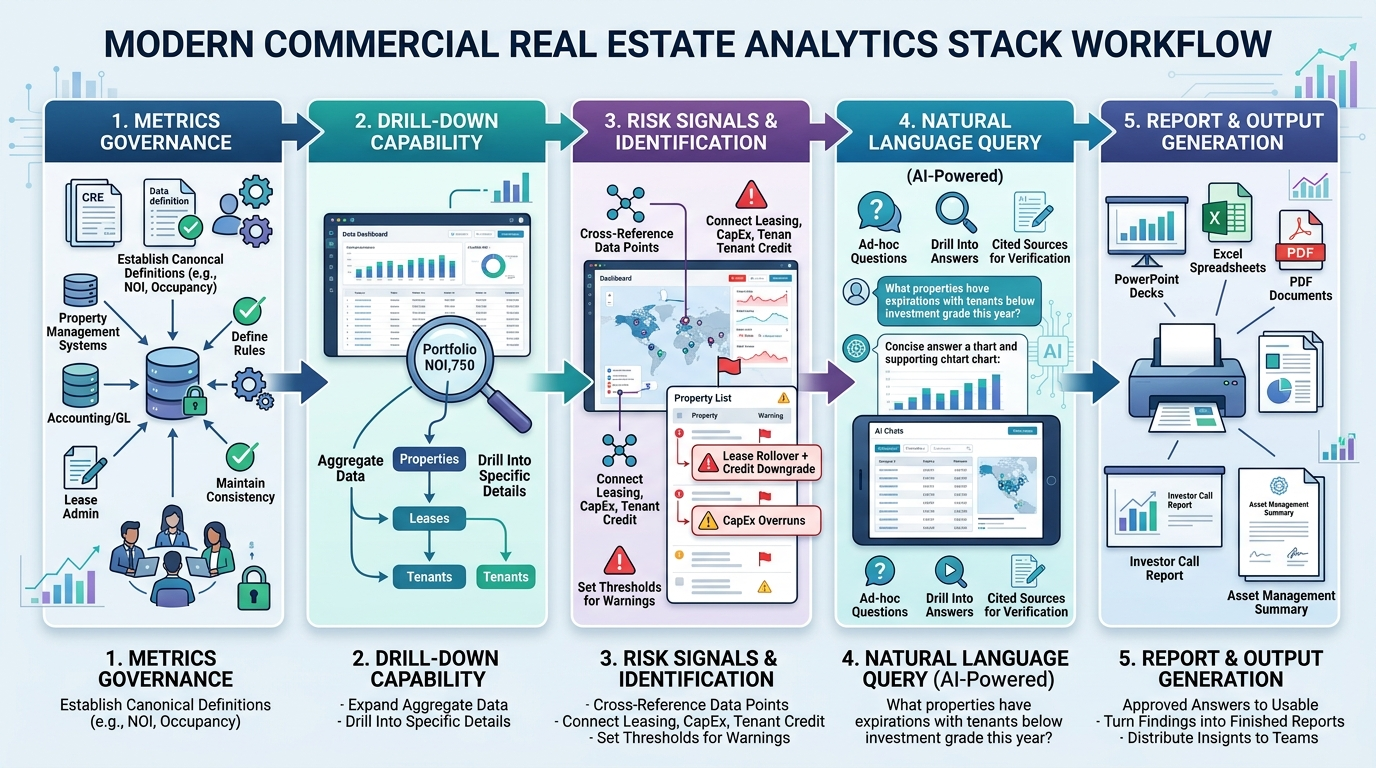
CRE risk analytics is the practice of watching for that overlap on purpose instead of by accident. It sits inside the broader question of what a [modern CRE analytics platform](/resources/commercial-real-estate-analytics-platforms/) needs to support. This article covers the data domains that generate most portfolio risk signals, how to separate a leading indicator from a prediction, a framework for triaging what gets flagged, and where the limits of this approach sit.
Key takeaways
- CRE risk analytics works best as an exception-surfacing practice, not a prediction engine: human judgment still owns the interpretation and the decision.
- Six domains generate most of the risk signals worth structured monitoring: tenant concentration, lease rollover clustering, occupancy deterioration, CapEx and budget variance, data-quality risk, and covenant or obligation triggers where the data supports it.
- A risk signal that appears alone is rarely the full story; compounding risk shows up when two or more moderate signals hit the same asset, tenant, or review window.
- Leading indicators (expiration dates, concentration ratios, budget variance thresholds) are not the same as predictions of tenant behavior or market outcomes, and risk analytics should stay in the leading-indicator lane.
- A usable triage framework needs five fields at minimum: the signal, the threshold or rule that fired it, the evidence behind it, an owner, and a next review date.
- Data-quality risk deserves its own monitoring lane, because an error in a source system propagates into every risk signal built on top of it.
What CRE risk analytics actually means
CRE risk analytics is a structured practice of scanning portfolio, lease, occupancy, and CapEx data for exception signals that fall outside an expected range and therefore justify a closer look before they turn into lost [NOI](/resources/ai-analyze-noi-cre-portfolio/), an unbudgeted capital call, or a missed renewal window.
That framing matters because "risk analytics" gets used loosely in CRE conversations: as a synonym for underwriting, market forecasting, or credit-scoring a tenant roster. This article is about a narrower, more mechanical job: turning raw portfolio data (rent rolls, lease abstracts, GL and budget actuals, CapEx tracking, and covenant terms where structured) into a defined set of rules that flag exceptions for review.
The output of good CRE risk analytics is not a verdict. It is a shorter list. Instead of scanning every lease, budget line, and occupancy report across a fifty-property portfolio each month, a working setup narrows that to the handful of items that cleared a threshold and genuinely need eyes on them. Everything past that point (whether to renegotiate a lease, delay a capital project, or escalate a covenant question) stays a human decision informed by context the data alone does not carry.
Six data domains where portfolio risk shows up first
Most CRE risk signals cluster into six recognizable domains. Each one has its own data source, its own typical rule shape, and its own failure modes.
Tenant concentration
Tenant concentration risk looks at how much of a property's or portfolio's income depends on a small number of tenants. A single tenant carrying 40% of a property's rent roll is a different risk profile than the same square footage spread across a dozen tenants, even if total occupancy and NOI look identical on a summary dashboard. Concentration is usually expressed as a percentage of rent, square footage, or NOI attributable to a tenant or an affiliated tenant group, calculated at the property level and often rolled up to the portfolio or fund level.
Rollover clustering
Rollover clustering happens when a disproportionate share of a property's or portfolio's leased square footage expires in the same window, often measured in rolling 12- or 24-month bands. A portfolio can show a healthy weighted-average lease term (WALT) overall while still carrying a rollover cliff in one submarket or one asset type. Clustering analysis needs expiration dates, option and notice-date windows, and square footage or rent by lease, not just an aggregate WALT figure.
Occupancy deterioration
Occupancy deterioration risk tracks a sustained downward trend in physical, leased, or economic occupancy rather than a single low reading. A property sitting at 85% leased occupancy might be stable or might be trending down from 94% two quarters ago; those are different risk situations that look the same in a snapshot. This domain depends on period-over-period comparisons at a consistent grain, and on being explicit about which occupancy definition is in use, since physical, leased, and economic occupancy can diverge meaningfully on the same asset. For a closer look at tracking occupancy, vacancy, and leasing performance over time, see [tracking occupancy, vacancy, and leasing performance](/resources/ai-occupancy-vacancy-leasing-performance/).
CapEx and budget variance
CapEx and budget variance risk flags projects or properties where committed, spent, or forecast capital diverges materially from the approved budget, or where carryover from a prior period is quietly inflating a current-year number. The risk is rarely the variance itself. Capital projects run over for legitimate reasons. The real risk is an unreviewed variance that keeps growing without anyone re-approving scope or budget. For a closer look at budget-to-actual tracking, see [analyzing CapEx budgets and property-level spending](/resources/ai-capex-budgets-property-spending/).
Data-quality risk
Data-quality risk is different from the other five: it's risk in the inputs themselves, not the underlying asset. Missing lease dates, mismatched property identifiers between the accounting system and the lease-abstraction source, or a rent roll that hasn't synced with a recent amendment all create conditions for every downstream signal to be wrong. A portfolio can look artificially safe or exposed purely because of a data pipeline problem, which is why these checks belong inside a risk-analytics practice rather than treated as a separate IT concern. [[SME: What's the most common source-system data-quality issue that shows up as a false risk signal in CRE portfolios: missing lease dates, mismatched property IDs, or something else?]]
Covenant and obligation signals
Covenant and obligation risk covers loan covenants, ground-lease terms, JV agreement triggers, and similar obligations that carry consequences if breached. This domain is genuinely useful only where the underlying terms exist in structured, queryable form. A great deal of covenant language still lives in unstructured PDFs and side letters, which means this domain often starts smaller and more manual than the other five, and shouldn't be represented as fully automatable unless the data supports it.
Leading indicators vs. predictions: what a risk signal can and cannot tell you
A leading indicator is a fact about the current state of the data: a lease expires in 90 days, a tenant carries 38% of a property's rent, a CapEx line is running 22% over budget at the halfway point of the fiscal year. Every one of those statements is verifiable against a source record today.
A prediction is a claim about what happens next: whether that tenant renews, whether that submarket's vacancy keeps rising, whether that CapEx overrun stays contained. CRE risk analytics, used honestly, produces the first kind of statement and stops there. It does not model tenant renewal probability from lease and payment history the way a credit-scoring system might, and it does not forecast market absorption. [Renewal-specific risk workflows](/resources/ai-lease-expirations-renewal-risk/) (including how to weigh option windows against tenant and market context) are their own topic; this article treats rollover exposure as one input into a broader risk view rather than a full renewal-risk model.
The practical reason to hold this line is that a risk signal dressed up as a forecast invites the wrong kind of trust. A tenant-concentration flag earns attention because the underlying math is checkable. A renewal-probability score earns skepticism the moment someone asks what it's based on, unless the firm has built and validated that model deliberately, with real outcome data. Most portfolios have not done that work, and claiming otherwise misrepresents what the system is actually doing.
When risks compound: reading across metrics instead of one at a time
A single moderate signal is often manageable on its own. The pattern worth building a process around is two or three moderate signals landing on the same asset in the same review window.
Take a property carrying a 35% tenant-concentration exposure to a single anchor, sitting in a submarket where occupancy has slipped for two consecutive quarters, with a deferred roof and HVAC CapEx line that has been pushed twice. Reviewed individually, none of those three items would necessarily trigger an escalation on its own: 35% concentration is watchable but not extreme, a two-quarter occupancy dip could be seasonal, and a deferred capital item happens on almost every asset at some point. Reviewed together, on the same property, in the same quarter, they describe a different situation: an asset whose income is concentrated in one relationship, sitting in a softening market, with deferred physical-condition risk that could affect that same anchor tenant's renewal decision. [[SME: Walk through one real instance where two moderate portfolio signals compounded into an issue that a single-metric view would have missed: what were the signals, and what happened next?]]
Catching that kind of overlap requires the signals to sit at a consistent grain (property-level, in this case) and to be reviewed together rather than routed to three different owners who each see only their slice. A leasing team member watching rollover exposure, a property-operations lead watching CapEx, and an asset manager watching occupancy can each be doing their job correctly and still miss the compounding pattern if nothing forces the three views into the same review.
The CRE Risk Signal Matrix: a framework for triage
A risk-analytics setup is only as useful as the process that turns a flagged signal into an actual review. The CRE Risk Signal Matrix gives each signal five fields, so a reviewer can see not just that something fired, but why, on what evidence, and who is responsible for the next look.
| Signal | Threshold / rule | Evidence | Owner | Next review |
|---|---|---|---|---|
| Tenant concentration | Single tenant ≥ 30% of property rent | Rent roll, current lease abstract | Asset manager | Quarterly, or on lease amendment |
| Rollover clustering | ≥ 25% of property SF expiring within 12 months | Lease expiration schedule, WALT calc | Leasing lead | Monthly during rollover window |
| Occupancy deterioration | 2+ consecutive quarters of decline, any occupancy type | Period-over-period occupancy report | Asset manager | Quarterly |
| CapEx / budget variance | Actual or forecast ≥ 15% over approved budget | Project budget, GL actuals, approval log | Property-ops or finance lead | At each budget re-forecast |
| Data-quality risk | Missing or conflicting key fields on a lease or asset record | Source-system reconciliation log | Data owner | On detection, before other signals reprocess |
| Covenant / obligation | Triggering ratio or date approaches contractual threshold | Loan or JV agreement terms (structured) | Portfolio finance | Set by covenant calendar |
The rule column keeps the trigger objective and auditable. The evidence column forces every flag to point back to a source record rather than a gut feeling. The owner and next-review columns are what turn a dashboard of flags into an actual accountability system. Without them, a risk matrix becomes a list nobody is responsible for closing. [[SME: When a risk signal surfaces inside a live Bayaan session, what evidence does the citation actually show the reviewer, and what can they click through to verify it?]]
Where this falls short
Risk analytics built this way is genuinely useful for triage, but it has real limits that are worth naming plainly.
Thresholds are only as good as the people who set and maintain them. A 30% concentration threshold that made sense for a diversified office portfolio might be too loose for a single-tenant industrial fund, and a threshold nobody revisits after the portfolio composition changes will eventually produce either alert fatigue or missed risk.
Data-quality problems don't stay contained to the data-quality domain. They inherit into everything downstream. A CapEx system that misclassifies a committed cost as a forecast cost will produce a variance signal that looks like a spending problem when it is actually a categorization problem. [[SME: What's a specific case where a CapEx or budget-variance signal turned out to be a data-quality issue rather than a real risk, and how was that caught?]]
Covenant and obligation data is frequently the weakest link. Many portfolios still keep loan covenants, ground-lease terms, and JV triggers in unstructured documents rather than queryable fields, which means this domain often starts as a manual review process, not a fully automated one.
Cross-metric compounding depends on consistent entity resolution across lease, financial, and CapEx systems: the same property has to be recognizable as the same property in all three. Portfolios running disconnected point systems without a shared property or tenant ID often can't do this reliably without integration work first.
None of this replaces underwriting judgment, market knowledge, or the negotiation experience that decides what actually happens once a signal is confirmed. A risk-analytics system tells a team where to look. It does not tell them what to do when they get there.
Turn portfolio questions into governed answers
See how Bayaan helps CRE teams connect governed business data, investigate portfolio questions, and generate trusted outputs.
Talk to BayaanBuilding a triage workflow that people actually use
A matrix full of flagged signals only helps if there's a defined path from "flagged" to "resolved." A workable triage workflow generally has five steps:
- Define the domain and the threshold. Write down the rule in plain language, tied to the specific data field it checks, and assign it an owner before it goes live.
- Route the signal to its owner, not to a shared inbox. A rollover-clustering flag should reach the leasing lead directly; a CapEx variance flag should reach property operations or finance. [[SME: In practice, who typically owns the "next review" step for a rollover or tenant-concentration signal: asset management, leasing, or portfolio risk, and how does that handoff work?]]
- Require evidence before escalation. The owner should be able to point to the specific rent-roll line, budget report, or lease abstract that triggered the flag before raising it further.
- Set a next-review date, not just a resolution. Some signals close outright; others get downgraded to a watch item with a defined follow-up date rather than disappearing from view.
- Feed outcomes back into the thresholds. If a rule fires too often to be useful or misses something it should have caught, that's a signal the rule itself needs recalibration, not just the underlying asset.
This is closer to an operating discipline than a piece of software. The technology can surface the signal and the evidence faster; the workflow is what makes the signal worth having in the first place.
Once a flagged risk moves from a watch item to a confirmed issue, it often becomes an agenda item in a recurring portfolio report. See [automated CRE reporting](/resources/automated-cre-reporting/) for how that handoff typically works.