

An asset manager opens the portfolio dashboard before a quarterly review and sees the same tiles she saw last quarter: occupancy, NOI, and a handful of trend lines. The dashboard tells her what happened. It doesn't tell her why NOI dipped at three specific properties, whether that dip connects to a lease rollover risk already flagged elsewhere, or what the finance team needs by Friday. She ends up in Excel anyway, pulling the actual analysis by hand from three different systems.
That gap, between a platform that displays metrics and one that supports the actual decisions built on top of them, is what separates a static reporting tool from a modern CRE analytics platform. This guide defines that gap in practice, covers the core metrics and workflows a platform needs to support, and gives a framework and buyer checklist for evaluating whether a platform closes it.
In this article
- A modern CRE analytics platform needs governed metrics, ad-hoc questions, drill-down, role-appropriate access, and report-ready output.
- Static dashboards answer what happened; asset managers and executives also need to investigate why.
- Recurring and ad-hoc analysis require different capabilities.
- NOI, occupancy, lease expirations, CapEx, and risk signals need consistent definitions.
- AI adoption is growing, but trust depends on governance and explainability.
- The Modern CRE Analytics Stack is Metrics → Drill-down → Conversation → Risk Signals → Delivery → Governance.
What is a modern commercial real estate analytics platform?
A modern CRE analytics platform connects to a firm's portfolio data, including property-management systems, the general ledger, lease administration, and CapEx tracking, and lets users analyze performance, investigate variances, and produce reporting output without every non-standard question requiring a manual export into Excel.
The word "modern" is doing real work here. Legacy CRE reporting tools were built around fixed dashboards and scheduled reports. A modern platform adds the capacity to ask a question that wasn't anticipated, drill from a portfolio-level number down to the property or lease line behind it, and move from an answer to a finished deliverable while enforcing who is allowed to see what.
This isn't a claim that dashboards are obsolete. Recurring KPI tracking still matters. The distinction is whether the platform's capability stops at the dashboard or extends into investigation and delivery.
Why static dashboards aren't enough anymore
Static dashboards answer the questions their designers anticipated, and little else. When an asset manager needs to know why NOI dropped at a specific property, or whether a flagged CapEx overrun correlates with a tenant credit downgrade, a fixed dashboard often has no path from the number to the underlying cause.
The investigation moves into Excel, becomes disconnected from governed metric definitions, and creates another manual workflow. A platform that cannot show its work when a number looks surprising keeps pushing real investigation back into spreadsheets, no matter how polished its dashboard looks.
Core CRE metrics a platform should support
| Metric category | What it covers | Common governance issue |
|---|---|---|
| NOI | Net operating income at property and portfolio level, including same-store definitions | Firms differ on how long a property must be held before it counts as same-store |
| Occupancy | Physical, leased, and economic occupancy | Different definitions produce different valid numbers unless one is designated canonical |
| Lease expirations | Rollover timing, WALT, tenant credit quality | Expiration data often lives at lease-line grain and gets flattened incorrectly |
| CapEx | Budgeted vs. actual spend, project status, deferred maintenance | Some regions use structured fields; others use memos or spreadsheets |
| Risk signals | Tenant credit risk, concentration risk, covenant thresholds | Signals need links back to the lease or loan data that triggered them |
A platform that displays these metrics without a documented, enforced definition behind each one has automated the appearance of consistency while leaving the underlying disagreement intact.
Recurring vs. ad-hoc analysis
| Recurring analysis | Ad-hoc analysis | |
|---|---|---|
| Example | Quarterly investor report, monthly occupancy tracking | Which properties have tenants below investment grade with leases expiring this year? |
| Structure | Known in advance, same format every cycle | Unknown until someone asks |
| What the platform needs | Templated output, consistent definitions, scheduled delivery | Flexible query capability, drill-down, and ability to combine metrics |
| Legacy-tool fit | Usually strong | Usually weak without Excel work |
| Failure mode | Reports become late or manually assembled | Every new question becomes an analyst request |
A platform built only for recurring analysis looks capable in a demo because the demo is usually the exact report it was designed for. The real test is the question nobody anticipated.
How asset managers use these platforms day to day
Asset managers spend much of their platform time investigating, not reporting. A typical workflow is: a portfolio-level KPI moves outside its normal range, the asset manager drills into the properties driving the change, cross-references related data such as lease expiration, CapEx delay, or tenant credit shift, and decides whether the movement needs escalation.
This workflow depends on drill-down from portfolio to property to lease line and on pulling adjacent data without leaving the platform to reconstruct the picture in Excel.
How executives use these platforms differently
Executives generally aren't drilling into lease-line detail. They're asking portfolio-level questions under time pressure before a board meeting, investor call, or capital-allocation decision. They need a cited, verifiable answer and the ability to turn that answer into a slide, one-pager, or other deliverable without a separate formatting step.
The Modern CRE Analytics Stack
| Stage | What it means | What's missing if this stage is absent |
|---|---|---|
| Metrics | Governed, consistently defined core metrics | Different reports risk different numbers |
| Drill-down | Move from portfolio figure to property, lease, or tenant | Investigation stops at the summary |
| Conversation | Natural-language ad-hoc question answering | Every new question becomes an analyst request |
| Risk signals | Flags connecting related data points | Risk is caught only through manual observation |
| Delivery | Turn an approved answer into a deck, sheet, or document | Analysis and reporting remain disconnected |
| Governance | Role-based access, audit logs, and source citations | Users cannot verify numbers or access controls |
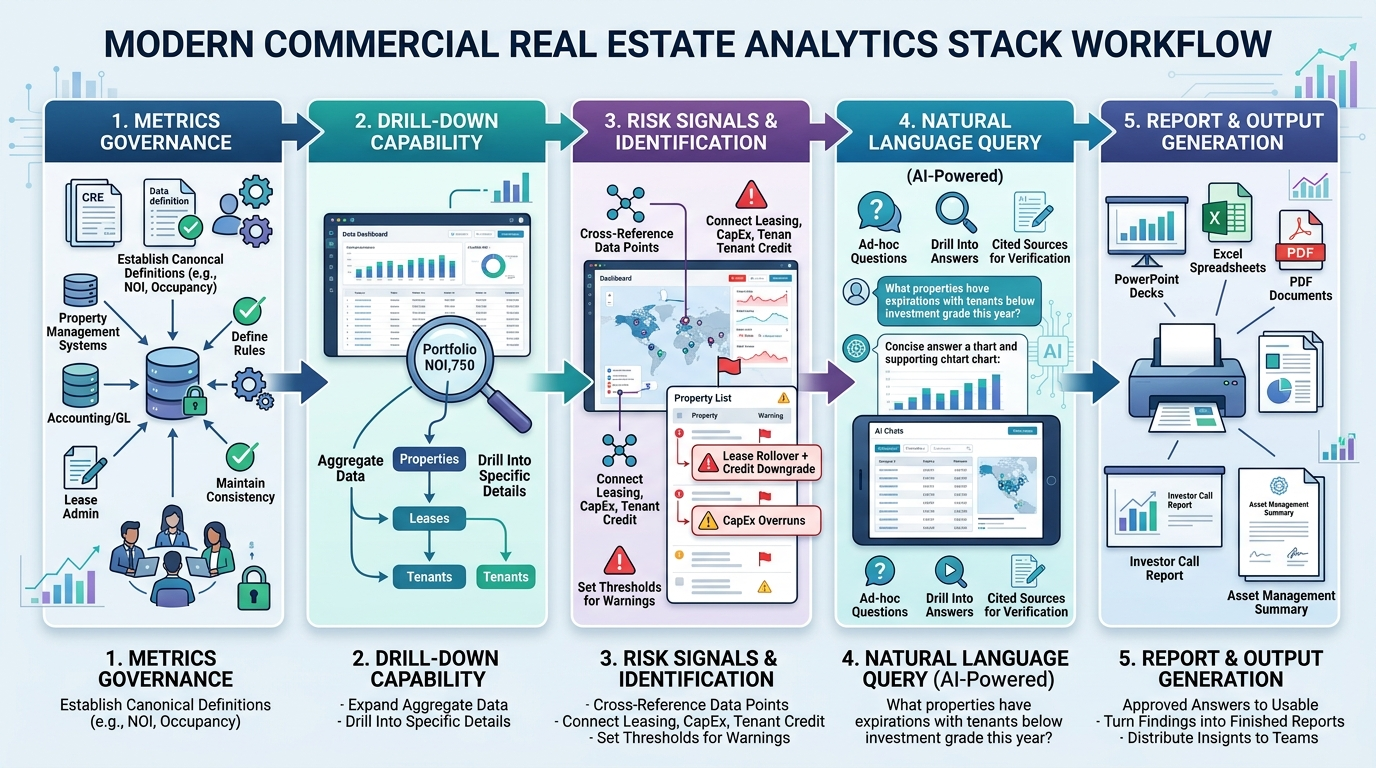
A worked illustration: an asset manager gets a risk signal for a tenant credit downgrade at a property with a lease expiring in eight months. She drills into the lease and rent roll, asks whether other portfolio properties have the same combination, receives three matching properties with sources cited, and exports the findings into a one-page summary.
Buyer checklist
- Can it answer a question that wasn't pre-built into a report without a manual export?
- Can users drill from a portfolio number to the property, lease, or tenant behind it?
- Are NOI, occupancy, and same-store definitions documented and enforced?
- Does role-based access operate at the data level?
- Does every figure carry a verifiable source citation and as-of date?
- Can an approved answer become a finished deliverable without manual formatting?
- Can it flag risk signals by connecting related data points?
- Is there an audit log of who accessed or changed what?
Where this falls short
- A platform doesn't fix ungoverned metric definitions on its own. If nobody has decided what occupancy means, the platform will faithfully display inconsistent source definitions.
- Adoption lags capability. Buying a capable platform does not automatically create trusted, adopted use.
- Vendor comparisons go stale. Use live demos and the evaluation framework rather than relying on static feature charts.
- Ad-hoc question answering still needs human review for high-stakes use. Investor, lender, and fiduciary outputs should receive the same review as human-built analysis.
How to start evaluating platforms in practice
- Write down three real questions your team asked last quarter that the current tool couldn't answer without Excel.
- Test drill-down with a real variance, not a clean demo dataset.
- Check metric governance before checking features.
- Confirm role-based access with a restricted-access user account.
- Time a real ad-hoc request against your current process.
How Bayaan fits the modern CRE analytics model
Bayaan is a governed enterprise AI workspace built on Microsoft Azure that connects to existing CRE data, answers ad-hoc portfolio questions with cited sources, and turns approved analysis into PowerPoint, Excel, or Word output. The point is not another dashboard; it is a governed path from portfolio question to verifiable answer to usable deliverable.
Turn portfolio questions into governed answers
See how Bayaan helps CRE teams connect governed business data, investigate portfolio questions, and generate trusted outputs.
Talk to Bayaan