
In this article
Portfolio-level NOI drops three percent quarter over quarter, and finance wants an answer before the Monday investor call. That number is an aggregate of dozens of properties, hundreds of general ledger accounts, and at least a few one-time items that shouldn't be treated as trend. Finding the two or three assets actually driving the decline, and the specific revenue or expense lines behind them, usually means a day or more of pulling reports, reconciling chart-of-accounts differences, and cross-checking budget assumptions by hand.
AI can compress that search significantly, but only after someone has encoded which NOI definition, which same-store rules, and which comparison period the firm actually uses. Skip that step and an AI tool will hand back a fast, confident, wrong answer. This article covers what changes NOI's definition, how to build an NOI bridge from portfolio to account level, and where AI-assisted drill-down genuinely helps versus where it still needs a human check.
Key takeaways
- NOI has no single universal definition across CRE firms. Scope choices around management fees, reserves, straight-line rent, and ground rent change the reported number materially.
- AI-assisted drill-down speeds up the path from a portfolio-level NOI change to the specific property, account, and driver behind it, but only once metric definitions are configured consistently.
- Same-store NOI comparisons require excluding recent acquisitions, dispositions, and non-stabilized assets, or the comparison mixes operating performance with portfolio composition changes.
- Recovery and CAM reimbursement timing can make an expense variance look like a revenue variance, or the reverse, depending on the billing cycle.
- An NOI bridge that walks from prior period to current period through discrete drivers is a faster diagnostic than comparing two static totals.
- Budget-vs-actual NOI comparisons only hold up when both sides use the same chart of accounts, the same period type, and the same treatment of one-time items.
What NOI means, and why the definition moves the number
Net operating income is a property's revenue less its operating expenses, before debt service, capital expenditures, depreciation, and income taxes. That part is consistent across the industry. What varies is scope: whether asset management fees sit inside or outside operating expenses, whether reserves for replacement are treated as an operating expense or excluded entirely, how straight-line rent and free-rent periods are handled in reported revenue, and whether ground rent or partial-interest adjustments are folded into the number.
The NCREIF PREA Reporting Standards have served as the institutional benchmark for private real estate reporting for more than three decades, co-sponsored by the National Council of Real Estate Investment Fiduciaries and the Pension Real Estate Association (RSM US, 2026). A 2025 update to those standards pushed toward more standardized income and expense categories and asset-level detail specifically to improve comparability across managers (Aprio, 2026) — itself a signal of how much variation existed before.
Practically, this means two properties in the same portfolio can report NOI under slightly different rules if they were acquired from different sellers or migrated from different accounting systems. Before AI, or a person, can compare NOI across a portfolio, the firm needs one documented definition of NOI and a mapped chart of accounts that AI tools and analysts both reference.
Budget vs. actual and period comparisons
NOI variance analysis usually starts with one of three comparisons: budget vs. actual for the current period, current period vs. prior period, or trailing-twelve-months vs. trailing-twelve-months a year earlier. Each answers a different question, and mixing them produces misleading conclusions.
| Comparison type | What it answers | Common pitfall |
|---|---|---|
| Budget vs. actual (current month or quarter) | Did the property perform to plan this period? | Budgets set a year in advance may not reflect known lease events |
| Period-over-period (Q2 vs. Q1) | Is performance trending up or down sequentially? | Seasonal expenses (snow removal, utilities) distort sequential comparisons |
| T12 vs. prior T12 | Is trailing performance improving on a rolling basis? | Masks a sharp one-quarter change inside a longer trend |
| Same-store T12 vs. prior T12 | Is operating performance improving, excluding portfolio composition changes? | Requires an accurate, maintained same-store property list |
A recovery or CAM reimbursement billed a quarter behind the expense it offsets is one of the most common sources of a false variance flag. If a property's utility expense spikes in Q3 but the corresponding tenant recovery isn't billed and recognized until Q4, a Q3 NOI comparison will show an expense variance that a Q4 comparison would show as a revenue variance. Neither is wrong; they're answering different questions about timing.
Building an NOI bridge from portfolio to property
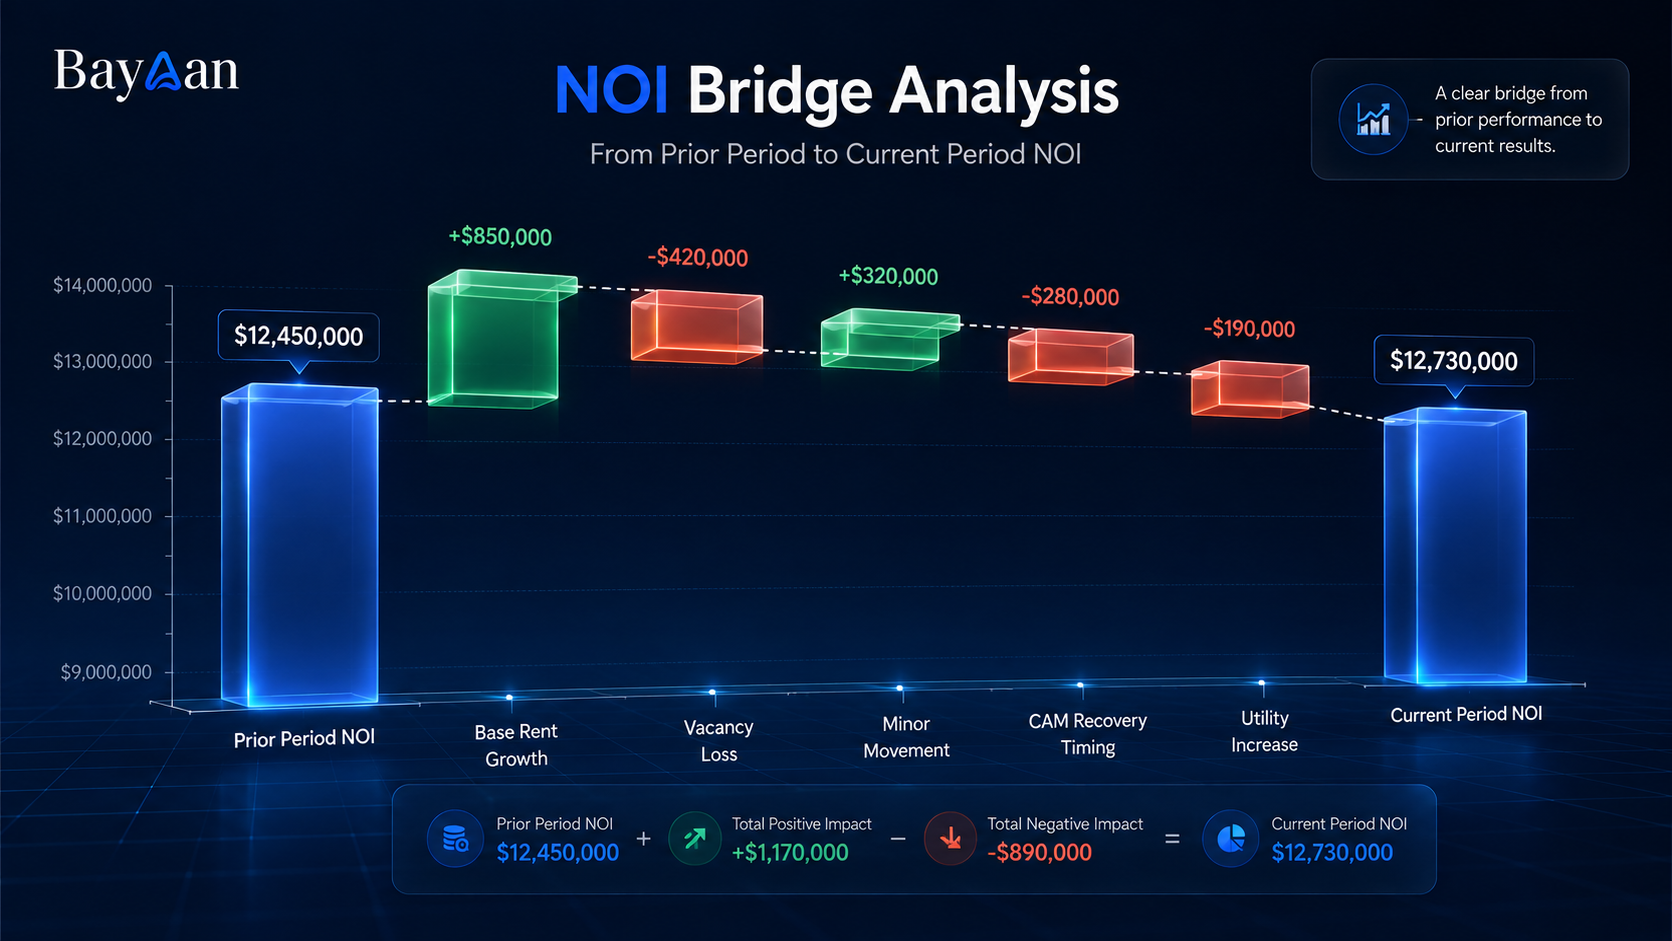
A static NOI comparison — this quarter's total against last quarter's total — tells you that something changed. It doesn't tell you what. An NOI bridge decomposes the change into discrete, addable drivers, which is what makes it useful for a diagnostic conversation rather than a single headline number.
Worked example. A ten-property portfolio reports Q2 NOI of $4.2 million against a Q1 total of $4.35 million, a decline of $150,000. A portfolio-level bridge might decompose that as:
- Base rent growth across the portfolio: +$60,000
- One property's tenant vacated at lease expiration, no backfill yet: −$180,000
- CAM recovery billed late at a second property (timing, not a real loss): −$45,000
- Utility expense increase across three properties, partially offset by recoveries: −$25,000
- Minor leasing and other movement: +$40,000
Net: −$150,000, matching the headline change. Once the bridge is built, the diagnostic conversation moves from "why did NOI drop" to "how do we backfill the vacant space and confirm the CAM recovery timing," which are the actual decisions asset management needs to make.
Drilling from portfolio to account and driver
The value of AI in this workflow is less about generating the bridge once and more about supporting the follow-up questions an asset manager or finance lead asks immediately after seeing it. A typical drill-down sequence looks like this:
- "Which properties drove the portfolio NOI decline this quarter?" — surfaces the two or three properties with the largest negative contribution.
- "What changed at [Property X]?" — breaks the property-level NOI change into revenue and expense components.
- "What accounts moved inside operating expenses?" — surfaces the specific general ledger accounts (repairs and maintenance, utilities, insurance) driving the expense-side change.
- "Is this a one-time item or a trend?" — requires either a tagged one-time-item flag in the source system or a human judgment call; AI can surface the account history but shouldn't silently decide.
- "Show me the source transactions behind that account." — the citation step, where a natural-language answer needs to point back to the specific GL entries or invoices it summarized.
That last step is where source citation matters most in NOI work specifically, because a wrong or stale GL export produces a confidently wrong NOI number with no visible warning sign unless the tool shows its source.
Recoveries, CAM, and why revenue variance isn't always what it looks like
Recoveries and common area maintenance (CAM) reimbursements complicate NOI analysis because they sit on the revenue side of the ledger but exist to offset specific operating expenses. A property with a triple-net lease structure and full expense pass-through should, in theory, show operating expenses and recoveries moving roughly in tandem. When they don't, the gap usually points to one of a few causes: a reconciliation that hasn't run yet, an expense category the lease doesn't allow the landlord to recover, occupancy below the recovery pool's assumptions, or a genuine cap on recoverable expenses being hit.
An AI tool that treats recoveries as generic "other revenue" will miss this relationship entirely and may flag a healthy reconciliation lag as a revenue problem. Encoding the recovery-to-expense relationship as part of the NOI model, rather than treating every account as an independent line item, is what turns a drill-down from a list of numbers into an explanation.
Same-store NOI: the comparison that requires the most setup
Same-store NOI is meant to isolate operating performance from portfolio composition. It compares NOI for a defined set of properties held in both the current and prior period, excluding recent acquisitions, dispositions, and properties still in lease-up or major renovation. Two firms can report different same-store NOI growth for an identical portfolio if they define "stabilized" differently or use different holding-period cutoffs for inclusion.
This is the metric where AI is most likely to produce a subtly wrong answer if the same-store property list isn't maintained as configured data. A newly acquired property that gets included in a same-store comparison by mistake will show artificial NOI growth that has nothing to do with operations — it's reflecting the acquisition, not performance. The fix isn't a smarter model; it's a maintained, dated same-store list that any drill-down references before running the comparison.
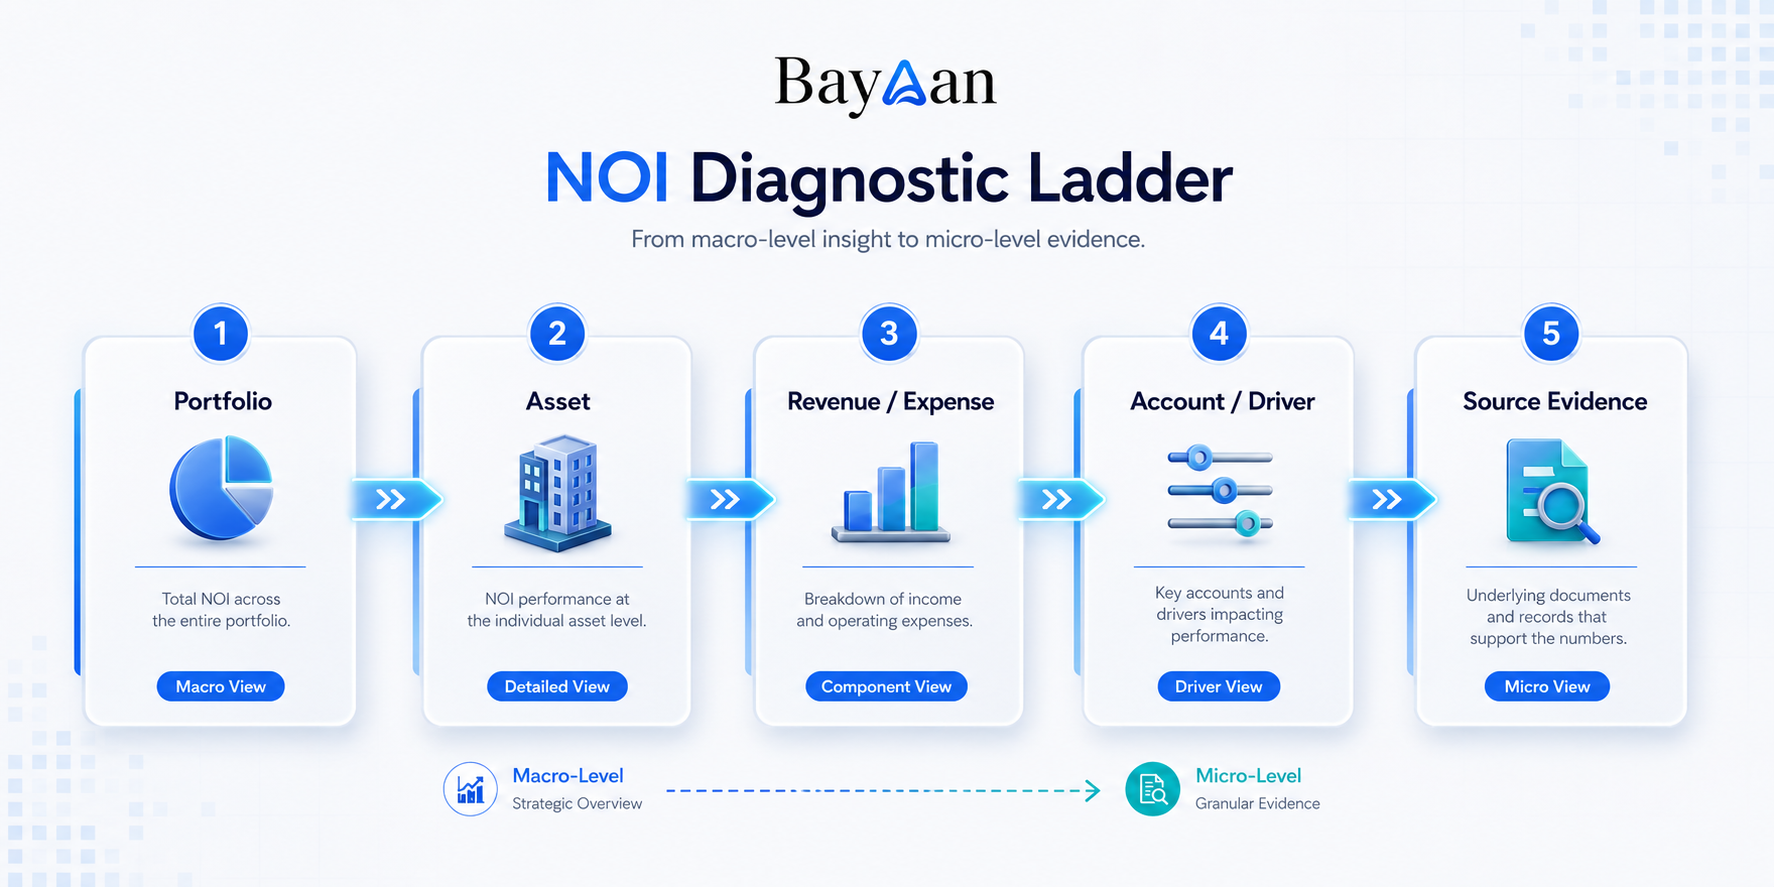
The NOI Diagnostic Ladder
Treat NOI investigation as five rungs, each one level more granular than the last, with the option to stop at whichever rung actually answers the question at hand.
| Rung | Question answered | Typical output |
|---|---|---|
| 1. Portfolio | Did total NOI move, and by how much? | Single number, period comparison |
| 2. Asset | Which properties drove the change? | Ranked property list with contribution |
| 3. Revenue / expense | Was the change on the income side or the cost side? | Two-line split per property |
| 4. Account / driver | Which specific GL accounts or lease events moved? | Account-level detail, tagged as one-time or recurring where possible |
| 5. Source evidence | What transaction, invoice, or lease clause supports this number? | Citation to the underlying record |
Most day-to-day questions resolve at rungs two or three. Investor reporting and audit-adjacent questions need rung five. A tool that can only answer at rung one, a single portfolio number with no path downward, doesn't actually change how the analysis gets done; it just moves the same manual drill-down into a chat window.
Where this falls short
AI-assisted NOI analysis has real limits, and treating it as a black box that always produces a trustworthy number creates more risk than the manual process it replaces.
Source-system errors propagate downstream without warning. If a property accountant miscodes an expense to the wrong GL account, an AI tool summarizing that account will repeat the miscoding confidently, and the error looks identical to a correctly sourced answer unless someone checks the citation.
Same-store and stabilization definitions require ongoing, deliberate maintenance. AI can apply a same-store rule consistently once it's configured, but it can't decide on its own which properties belong on that list this quarter, and a stale list produces a wrong comparison that looks structurally sound.
One-time items need a human judgment call before they're excluded from a trend view. A lease termination fee, an insurance settlement, or a one-quarter tax refund can distort an NOI trend line if left in, but automatically excluding anything unusual risks hiding a real, recurring problem under the label of "one-time."
Timing lags between an expense and its offsetting recovery mean a single-period NOI comparison can flag a problem that resolves itself the following quarter once the reconciliation posts. Reading NOI variance without checking whether a recovery cycle is mid-stream is a common source of false urgency.
Turn portfolio questions into governed answers
See how Bayaan helps CRE teams connect governed business data, investigate portfolio questions, and generate trusted outputs.
Talk to BayaanHow to evaluate an NOI analysis workflow before you rely on it
- Confirm the tool lets you see and edit the firm's NOI definition rather than applying a fixed, generic one.
- Check whether same-store property lists are maintained as dated, versioned configuration, not inferred automatically each time.
- Ask whether every NOI figure links back to a specific source transaction or GL export, and whether a user can actually open that source.
- Test the tool on a known variance from a prior quarter and see whether its bridge matches what your finance team already determined manually.
- Confirm recoveries and CAM reimbursements are modeled as linked to specific expense categories, not treated as generic revenue.
- Review how the tool flags one-time items, and confirm it surfaces the flag for human review rather than silently excluding items from trend data.
Bayaan connects to governed CRE data in your Azure environment, answers portfolio and property questions with a cited source, and can turn an approved NOI analysis into a formatted deck or spreadsheet without a manual rebuild. If you're working through a specific NOI variance problem across your portfolio, ARC can walk through how that drill-down would work against your own data.