
In this article
A commercial real estate firm may know that a lease-expiration report exists without knowing which system owns it, whether amendments are reflected, what tenant hierarchy it uses, or when it was last refreshed. The data is present, yet using it still requires an analyst who understands the systems, definitions, permissions, and reporting history.
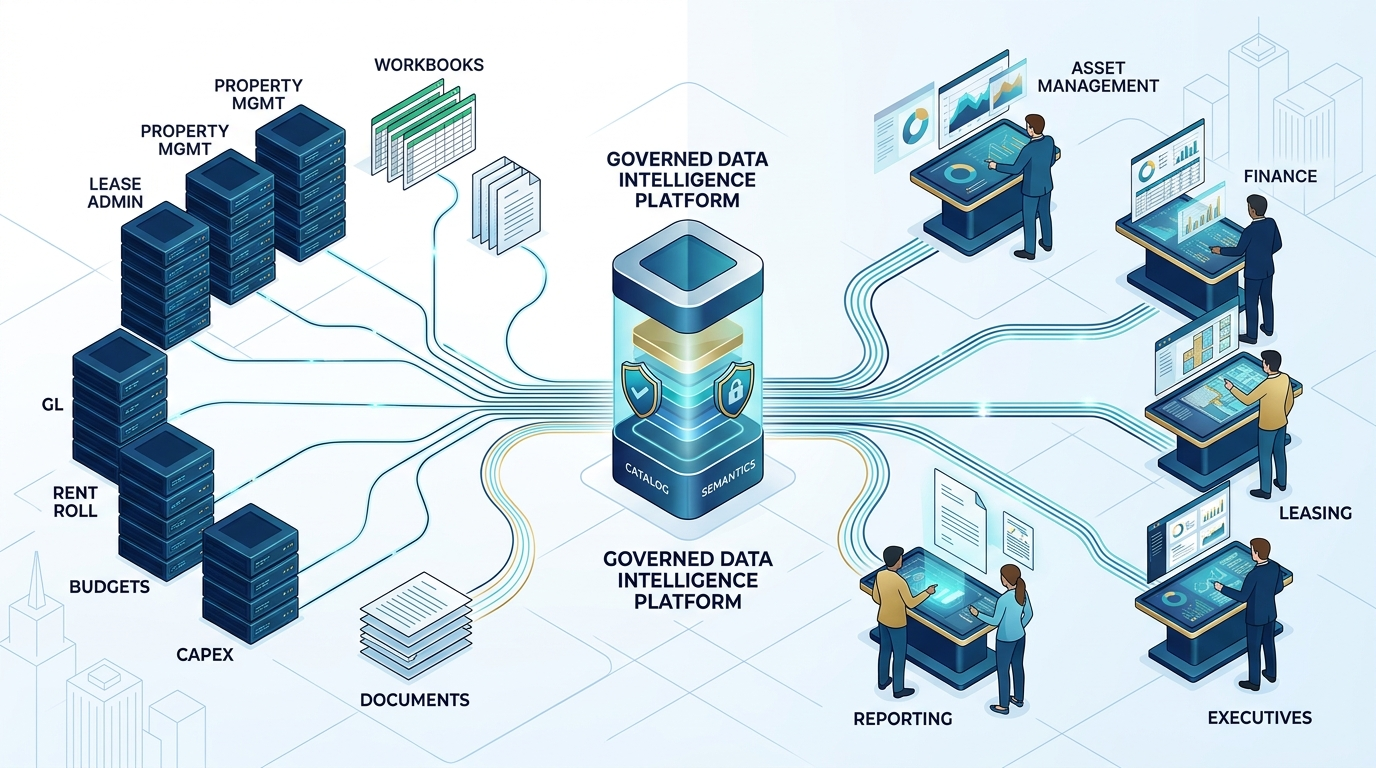
A data intelligence platform for commercial real estate is a software and governance layer that helps people find, understand, trust, access, analyze, and use portfolio data. It sits above or across raw systems and adds context such as metadata, semantic definitions, lineage, ownership, permissions, quality signals, query access, and delivery workflows. The term is not a universally standardized product category, so buyers should evaluate the underlying capabilities rather than the label alone.
This guide defines the category, maps its capability stack, explains what it does not replace, and provides a CRE-specific evaluation method.
Key takeaways
- A CRE data intelligence platform makes portfolio data discoverable, understandable, governed, queryable, analyzable, and usable across business workflows.
- The category is broader than a warehouse because it adds business context, governance, access, and consumption capabilities above storage and modeling.
- It is broader than a dashboard because it supports discovery, definitions, lineage, permissions, ad-hoc questions, AI access, and delivery beyond predefined visuals.
- Commercial real estate needs this layer because leases, rent roll, occupancy, NOI, CapEx, budgets, properties, tenants, funds, and joint ventures have different grains, owners, effective dates, and access rules.
- A platform does not repair inaccurate source data, settle disputed definitions, or replace human ownership of data quality and business decisions.
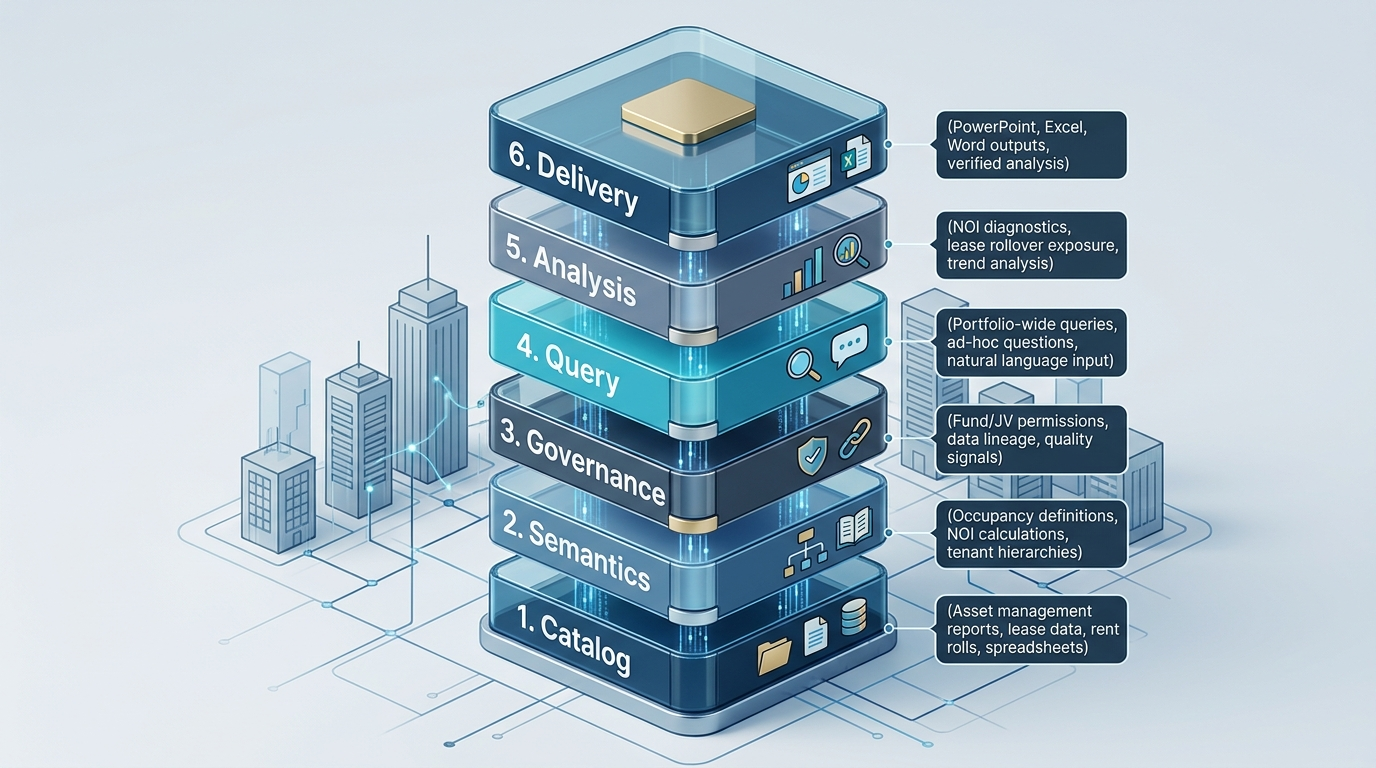
- Buyers should evaluate the full Data Intelligence Stack: Catalog → Semantics → Governance → Query → Analysis → Delivery.
What is a data intelligence platform for commercial real estate?
A data intelligence platform for commercial real estate is an environment that combines technical and business context so authorized users can locate, interpret, govern, query, analyze, and apply portfolio data. Its distinguishing feature is not a single database or dashboard. It is the coordinated layer that makes data understandable and usable across systems and roles.
The category often includes:
- A searchable catalog of datasets, reports, fields, models, documents, and owners
- Metadata describing source, grain, refresh status, quality, sensitivity, and downstream use
- Shared definitions for metrics and entities
- Lineage from source systems through transformations to reports and outputs
- Permission controls aligned with roles, funds, joint ventures, properties, regions, and sensitive fields
- Search, SQL, natural-language, or guided query experiences
- Analytical workflows for comparison, variance, trend, concentration, and diagnostic analysis
- Delivery into dashboards, reports, spreadsheets, presentations, documents, or supported operating workflows
Industry sources commonly describe data intelligence platforms as unifying capabilities such as metadata, governance, lineage, quality, discovery, and AI-enabled use. That supports the category framing, but vendor definitions vary and should not be treated as an agreed standard. Teradata describes a data intelligence platform as a software layer that organizes metadata, evaluates quality and risk, and makes trusted data discoverable and usable. Alation describes the category around metadata management, governance, lineage, quality, discovery, and stewardship.
In CRE, the value of those capabilities depends on domain modeling. A generic catalog entry called “lease table” is not enough. Users need to know whether it contains active leases only, how amendments are represented, which expiration date controls, whether suites are duplicated, and which tenant rollup is approved.
For the broader data-foundation context, see Commercial Real Estate Data Analytics: The Complete Guide for 2026 (A11).
Why does commercial real estate need a data intelligence layer?
Commercial real estate data becomes difficult to use because it crosses operational systems, legal documents, ownership structures, reporting periods, and teams. The challenge is not limited to technical integration.
Consider a portfolio question such as:
Which office assets have the highest lease rollover exposure in the next 24 months, measured by annual base rent?
A trustworthy answer may require:
- Lease commencement and expiration records
- Amendments and extensions
- Tenant and parent-company mappings
- Property, building, and suite hierarchies
- Annual base rent definitions
- Fund and joint-venture scope
- Effective dates and reporting cutoffs
- User permissions
- Source freshness and lineage
The same business term can also mean different things. Occupancy may be physical, leased, or economic. NOI may include or exclude specific items depending on reporting purpose. CapEx values may represent budget, approved amount, commitment, invoice, payment, or forecast. A portfolio total can change when same-store membership changes even if property performance does not.
A data intelligence layer exposes this context so a user can tell what the number means before relying on it.
The Data Intelligence Stack
The Data Intelligence Stack is a six-layer framework for evaluating whether a platform makes CRE data genuinely usable.
| Layer | Core question | CRE evidence |
|---|---|---|
| Catalog | Can users find the right asset? | Dataset, report, workbook, document, owner, refresh status |
| Semantics | Do users understand the meaning? | Metric definition, formula, grain, hierarchy, effective-date rule |
| Governance | Can the organization trust and control use? | Ownership, stewardship, lineage, quality, permissions, audit |
| Query | Can authorized users retrieve the right information? | Search, SQL, natural language, filters, source-aware retrieval |
| Analysis | Can users investigate performance and risk? | Variance, trend, concentration, diagnostic drill-down |
| Delivery | Can verified analysis enter a business workflow? | Dashboard, Excel, PowerPoint, Word, recurring report, action record |
A product does not need to own every layer internally. It may coordinate warehouse, catalog, governance, BI, AI, and reporting services. The important question is whether the user experiences one governed chain from source to decision-ready output.
Layer 1: Catalog and metadata
The catalog layer tells users what data assets exist, where they came from, who owns them, and whether they are suitable for a particular use. Metadata is the context attached to those assets.
A CRE catalog might include:
| Metadata field | CRE example |
|---|---|
| Asset name | Monthly lease snapshot |
| Business description | Active lease terms and rent schedules by suite |
| Source system | Approved lease-administration database |
| Grain | One row per lease component and effective period |
| Owner | Lease administration |
| Steward | Portfolio data team |
| Refresh | Last successful load and expected cadence |
| Sensitivity | Tenant, financial, or restricted JV information |
| Downstream use | Rollover report, WALT analysis, investor reporting |
| Known limitation | Amendments posted after cutoff appear next cycle |
Discovery matters because firms often have multiple files or reports with similar names. One occupancy workbook may be current for asset-management review, while another supports accounting close. A catalog should help the user identify the approved asset rather than choose the first search result.
Cataloging also reduces knowledge concentration. If only one analyst knows which rent-roll extract feeds an executive report, the organization has a people dependency rather than a durable data process.
Layer 2: Semantic definitions and business context
The semantic layer defines the approved meaning of metrics, entities, relationships, and business rules. It lets users ask questions in CRE language without silently changing the calculation.
A governed metric entry should include:
- Name and business definition
- Formula or calculation logic
- Grain
- Source fields
- Entity and ownership scope
- Time basis and effective-date rule
- Currency and unit conventions
- Allowed variants
- Owner and approval status
For example, “lease exposure” could be measured by rentable area, annual base rent, total contractual rent, NOI contribution, or tenant count. Each measure answers a different question. The platform should reveal the chosen definition and allow approved variants where necessary.
Entity meaning is equally important. A tenant can appear as a legal entity on a lease, a billing entity in accounting, a parent company in concentration analysis, and a brand name in property reports. The semantic layer should govern those relationships rather than force each report author to rebuild them.
For detailed source-of-truth modeling, see Commercial Real Estate Database: How to Build a Single Source of Truth (A13).
Layer 3: Governance, lineage, quality, and permissions
Governance defines who owns the data, which rules apply, how access is enforced, and what evidence exists when a value is challenged.
A CRE governance layer may cover:
- Data owner and steward assignments
- Approval of metric definitions
- Data-quality rules and issue workflows
- Lineage from source to transformation to output
- Role, fund, joint-venture, property, region, and field-level permissions
- Classification of sensitive tenant, financial, investor, or employee information
- Audit records for administrative and access-related actions
- Change control for schema, definitions, and reporting logic
Lineage should answer practical questions. If an asset manager challenges an occupancy number, the reviewer should be able to identify the source system, snapshot date, denominator, property scope, transformation, and report where the value appeared.
Quality signals should also be specific. A generic “trusted” badge is less useful than evidence that property IDs reconciled, required lease dates were present, duplicate suite records were checked, and the source refreshed successfully.
Permissions must apply before restricted information reaches the user. A fund-level executive may have broad portfolio access while an external operating partner should see only designated assets and approved fields.
Layer 4: Search and query access
The query layer gives authorized users a practical way to retrieve information. Access may include catalog search, report search, SQL, semantic APIs, guided filters, natural-language questions, or document retrieval.
The platform should route each question to the appropriate source and method. Structured questions about lease expirations, occupancy, NOI, or CapEx may require database queries. Questions about a lease clause, investment memo, or asset review may require document retrieval.
A useful query experience should:
- Identify the intended metric and entity scope.
- Resolve time periods and effective dates.
- Apply the user’s permissions.
- Use approved semantic definitions.
- Query or retrieve from the correct source.
- Return the result with source, scope, filter, definition, and timestamp context.
- Ask for clarification when the request remains ambiguous.
Natural-language access can reduce dependency on SQL, but it does not remove the need for precise definitions. “Show occupancy this quarter” still requires the system to determine which occupancy definition, asset set, and date basis apply.
For the AI-to-data architecture behind this access, see How to Connect an AI Assistant to Commercial Real Estate Data (A16).
Layer 5: Analysis and decision support
The analysis layer helps users move from retrieval to interpretation. Common CRE analysis modes include:
- Comparison: Compare property, market, fund, or period performance.
- Variance: Analyze actual versus budget, forecast, or prior period.
- Trend: Track occupancy, NOI, leasing activity, rent, or CapEx over time.
- Concentration: Identify exposure by tenant, lease expiration, geography, or property type.
- Diagnostic drill-down: Move from portfolio to property, tenant, suite, project, account, or transaction.
- Exception review: Surface assets or records that violate an approved threshold or rule.
A platform should separate facts from interpretations. If repairs and maintenance expense increased, that is a result from financial data. Whether it reflects an unusual event, timing, reclassification, or a persistent operating issue requires supporting evidence and review.
Analysis also depends on grain. Joining lease-level records to property-level financials can duplicate values if the model does not control the relationship. A data intelligence platform should expose or guard against such mismatches rather than hide them behind a chart.
Layer 6: Delivery into finished work
Delivery is the point where verified analysis enters an operational or reporting workflow. The output may be a dashboard, spreadsheet, presentation, document, scheduled report, action list, or an approved downstream system.
Typical CRE deliverables include:
- Monthly asset-management reviews
- Executive portfolio summaries
- Investment committee materials
- Investor or lender reporting inputs
- Lease-expiration schedules
- CapEx variance workbooks
- Property-level operating reports
The delivery layer should preserve the link between the output and its source evidence. A slide stating that five properties drove the NOI decline should retain the approved metric, period, property scope, and source behind the claim. An Excel workbook should distinguish formulas, static values, assumptions, and source references.
A platform that ends at an answer may still leave the reporting team with hours of manual assembly. A mature workflow connects governed analysis to reviewable business artifacts without removing human approval.
Worked example: Investigating occupancy deterioration
Assume an asset-management leader asks:
Which office properties experienced the largest decline in leased occupancy this quarter, and what lease events explain the change?
Catalog
The platform identifies the approved quarterly occupancy model, the lease-event dataset, their owners, refresh status, and known limitations. It distinguishes these assets from older workbooks or reports with similar names.
Semantics
The platform confirms that the question uses leased occupancy, not physical or economic occupancy. It identifies the approved rentable-area denominator, quarter-end snapshot dates, office portfolio scope, and same-store rule if one applies.
Governance
The user’s role is mapped to authorized funds, joint ventures, and properties. Lineage connects the occupancy result to approved source records and transformations.
Query
The system compares quarter-end snapshots, ranks the largest declines, and retrieves relevant commencements, expirations, terminations, contractions, expansions, and move-out events.
Analysis
The platform separates denominator changes from lease events. A property can show lower occupancy because space was added to the denominator, not because a tenant moved out. The analysis should expose that difference.
Delivery
The results are arranged into a reviewable table or presentation section with property, occupancy change, relevant lease events, source references, assumptions, and items requiring asset-manager commentary.
Human review
The asset manager confirms whether each data event reflects the operating reality, adds negotiation or leasing context, and decides which properties need action. The platform supports evidence assembly; it does not make the leasing decision.
What does a data intelligence platform not replace?
A CRE data intelligence platform usually complements rather than replaces the rest of the stack.
| Existing layer | Why it remains necessary |
|---|---|
| Property, lease, accounting, and project systems | They run operational processes and remain systems of record for specific data |
| Database, warehouse, or lakehouse | They provide durable storage, history, transformation, and analytical models |
| Integration pipelines | They move and reconcile data across sources |
| BI tools | They provide repeatable visual monitoring and dashboards |
| Document repositories | They store leases, amendments, reports, and other evidence |
| Security and identity systems | They authenticate users and support access enforcement |
| Data governance program | People still define ownership, policy, quality, and change control |
| CRE experts | They interpret leasing, operations, capital decisions, and investment context |
The category boundary is important. A17 defines the data-intelligence capability stack. The head-to-head comparison of platforms, warehouses, and BI belongs in CRE Data Platform vs. Data Warehouse vs. BI Tool: What’s the Difference? (A18).
The CRE Data Intelligence Maturity Ladder
Use this maturity ladder to assess whether a platform initiative has enough foundation to succeed.
| Stage | Operating pattern | Primary risk | Next capability |
|---|---|---|---|
| 1. Isolated | Reports and spreadsheets are maintained by individuals | Version conflict and key-person dependency | Inventory and ownership |
| 2. Cataloged | Assets and owners are documented | Definitions still differ | Semantic governance |
| 3. Governed | Definitions, lineage, quality, and permissions are established | Access remains technical | Business-friendly query |
| 4. Queryable | Authorized users can retrieve approved data | Analysis may not enter workflow | Diagnostic analysis and delivery |
| 5. Operationalized | Verified analysis flows into repeatable, reviewable outputs | Governance can drift | Continuous evaluation and stewardship |
A firm does not need to perfect every earlier stage before testing a narrow use case. However, skipping ownership, definitions, and permissions creates risk later. A polished AI or dashboard interface cannot compensate for an unknown source or disputed metric.
Where this approach falls short
The category label is inconsistent
Vendors use “data intelligence,” “data platform,” “analytics platform,” “data cloud,” and related labels differently. A feature list may cover only catalog and governance, while another product spans storage, BI, and AI. Category names should not substitute for architecture review.
Source errors still propagate
If lease expiration dates, occupied area, account mappings, or CapEx status are wrong upstream, the platform may return the wrong result with perfect lineage. Traceability helps reviewers find the problem; it does not make incorrect source data correct.
Definitions require organizational agreement
Technology can store several definitions of NOI or occupancy, but leadership and domain owners must decide which variants apply to each workflow. A platform cannot resolve a policy disagreement silently.
Unstructured documents remain difficult
Lease amendments, scanned PDFs, tables, handwritten annotations, and conflicting document versions may require abstraction and validation before portfolio-wide analysis. Retrieval confidence is not the same as legal or operational confirmation.
Permissions require ongoing ownership
Fund structures, joint ventures, property assignments, employee roles, and external partners change. Access models need testing, recertification, and audit ownership.
Data intelligence does not replace business judgment
A system can identify concentrated rollover, occupancy deterioration, or CapEx variance. It cannot decide a renewal strategy, approve capital, assess a tenant negotiation, or make an investment decision without appropriate human judgment.
Turn portfolio questions into governed answers
See how Bayaan helps CRE teams connect governed business data, investigate portfolio questions, and generate trusted outputs.
Talk to BayaanHow should CRE buyers evaluate a data intelligence platform?
Start with one business workflow and test whether the candidate platform supports every required layer.
Evaluation scorecard
| Evaluation area | Buyer question | Evidence to request |
|---|---|---|
| Catalog | Can users find approved datasets, reports, and documents? | Search demo using CRE assets and similar versions |
| Metadata | Can users see owner, grain, source, refresh, sensitivity, and limitation? | Asset detail page and metadata workflow |
| Semantics | Can approved definitions and variants be governed? | NOI or occupancy definition with formula and scope |
| Identity | Can property, tenant, lease, suite, fund, and JV hierarchies be represented? | Entity model and alias handling |
| Lineage | Can a user trace a number from output to source? | End-to-end lineage for one CRE metric |
| Quality | Are failures and stale data visible? | Quality rules, alerts, issue ownership, refresh history |
| Permissions | Are restrictions enforced before query or retrieval? | Role and entity-scope test |
| Query | Can technical and nontechnical users retrieve approved information? | SQL, semantic, guided, or natural-language demo |
| Documents | Can unstructured evidence be found with permissions and citations? | Lease or report retrieval example, if supported |
| Analysis | Can users compare, decompose, and diagnose? | Portfolio-to-property drill-down |
| Delivery | Can findings enter reports, decks, sheets, or workflow? | Reviewable output with provenance |
| Operations | Are changes, failures, usage, and administrative actions observable? | Audit, monitoring, and ownership demonstration |
A practical selection process
- Select a representative workflow, such as lease rollover, occupancy decline, NOI variance, or CapEx monitoring.
- Map every required source, field, grain, definition, permission, analysis step, and output.
- Identify which stack layers already exist and which are missing.
- Ask vendors to demonstrate the workflow using realistic CRE ambiguity and access cases.
- Test conflicting definitions, stale data, missing entities, incorrect joins, and unauthorized requests.
- Confirm what the product replaces, what it integrates with, and what your team must continue operating.
- Assign owners for data quality, semantics, access, platform configuration, and business approval.
- Measure adoption through completed workflows and reduced friction, not feature activation alone.