
In this article
Commercial real estate organizations have more data than ever. Property-management systems contain lease information. Accounting platforms contain financial performance. Spreadsheets track forecasts, budgets, and capital projects. Documents store lease abstracts, lender requirements, and investment committee materials. Yet despite all this information, many firms still struggle to answer straightforward portfolio questions quickly and confidently.
The challenge is rarely a lack of dashboards. More often, the problem is that portfolio data lives across multiple systems, follows different definitions, and arrives at different levels of detail. One team measures occupancy one way; another uses a different definition. Lease events exist in one system while financial activity sits somewhere else. By the time teams reconcile everything, the reporting cycle has already begun.
Commercial real estate data analytics has therefore become less about visualization and more about creating a connected, governed environment where portfolio information can be trusted, analyzed, and used consistently across teams. The organizations making the most progress are focusing on data quality, data integration, governance, and analytics access simultaneously rather than treating them as separate projects.
This guide explains how modern commercial real estate data analytics works in 2026, what data foundations matter most, how AI changes portfolio analysis, and what firms should evaluate before investing in new analytics initiatives.
---
Key takeaways
- Commercial real estate analytics quality depends more on data consistency and governance than on dashboard design.
- Most portfolio information spans multiple systems that operate at different grains, ownership levels, and refresh cycles.
- A reliable analytics environment requires source systems, standardization, governance, and analysis layers working together.
- Structured and unstructured CRE data both contribute to portfolio decision-making and must often be analyzed together.
- AI is expanding access to portfolio analytics, but data quality and governance remain prerequisites for trustworthy answers.
- Firms that treat analytics as an enterprise capability rather than a reporting project are better positioned for AI-driven workflows.
---
What is commercial real estate data analytics?
Commercial real estate data analytics is the discipline of collecting, organizing, governing, analyzing, and interpreting portfolio data to support operational, financial, leasing, investment, and strategic decisions. Unlike basic reporting, analytics focuses on understanding why performance changed, identifying emerging risks, comparing assets, and helping decision-makers act on evidence rather than assumptions.
At its simplest level, analytics answers questions such as:
- Which assets contributed most to an NOI decline?
- Which leases expire in the next 18 months?
- How does economic occupancy compare with leased occupancy?
- Which capital projects are over budget?
- Which tenants represent the greatest concentration exposure?
The complexity emerges because none of these questions typically resides within a single system. A leasing question may require data from lease-management software, accounting systems, spreadsheets, and document repositories simultaneously.
Modern CRE analytics therefore depends on the ability to connect multiple systems while preserving business definitions, permissions, and lineage. A visually attractive dashboard cannot compensate for inconsistent source data, conflicting definitions, or incomplete integration.
---
Why CRE analytics is uniquely difficult
Many industries struggle with fragmented data, but commercial real estate introduces additional complexity because nearly every important portfolio object changes over time and exists at multiple levels of hierarchy.
A lease belongs to a tenant. A tenant occupies one or more suites. Suites belong to properties. Properties belong to portfolios, funds, ownership structures, and reporting groups. A seemingly simple leasing metric can therefore require information from several interconnected layers.
CRE teams also work with multiple definitions that appear similar but serve different business purposes.
| Category | Common Variations |
|---|---|
| Occupancy | Physical, leased, economic |
| Revenue | Contractual, billed, collected |
| NOI | Portfolio-defined, property-defined, same-store variants |
| CapEx | Budgeted, committed, contracted, invoiced, paid |
| Lease Events | Expiration date, notice date, option date |
Without governance, teams often compare metrics that sound identical but are calculated differently. The result is confusion, delayed reporting, and reduced trust in analytics outputs.
---
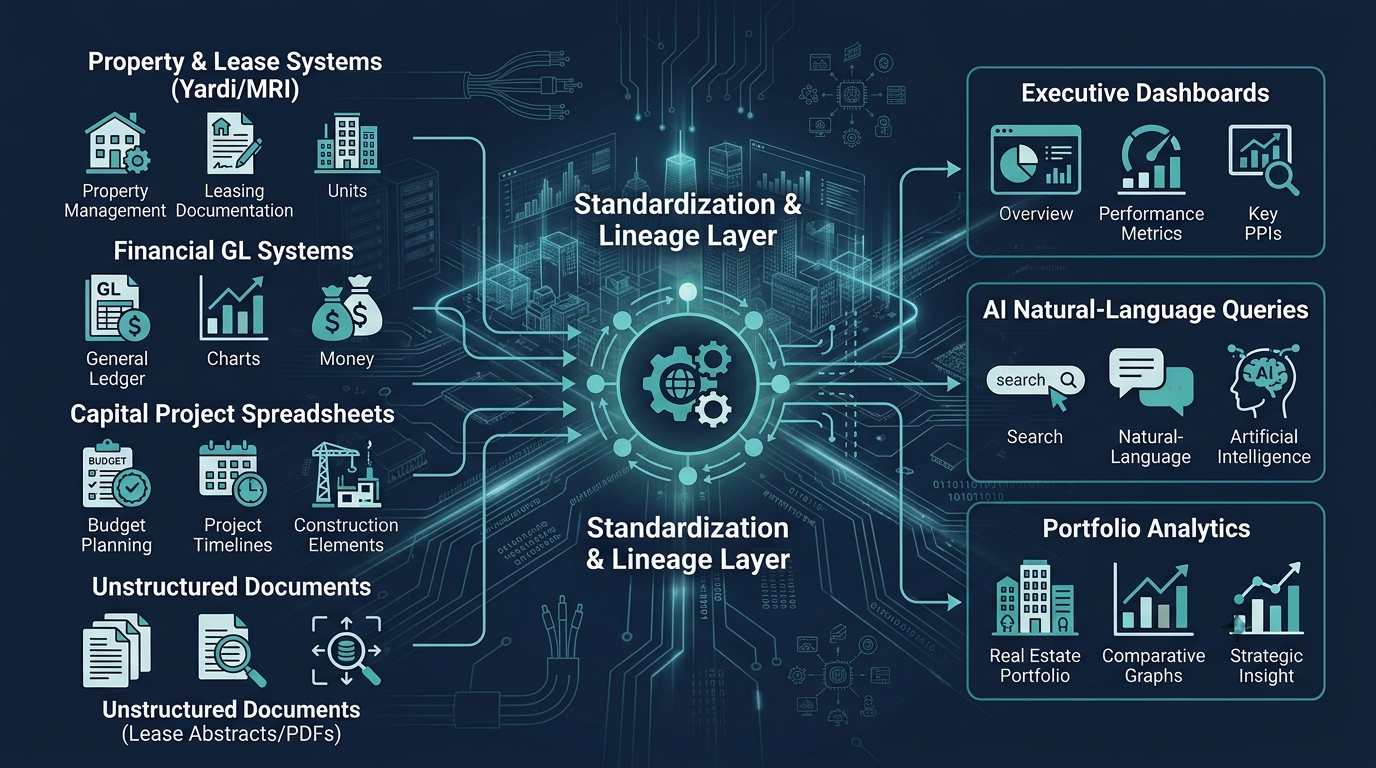
The CRE data landscape: where portfolio information actually lives
Most commercial real estate firms operate dozens of systems rather than a single unified platform. The analytics challenge begins with understanding where key portfolio information originates.
Property and lease systems
These systems typically store:
- Properties
- Buildings
- Suites
- Tenants
- Lease terms
- Renewal options
- Expiration schedules
Financial systems
These systems typically store:
- General ledger records
- Revenue
- Expenses
- Budgets
- Forecasts
- Account-level activity
Capital project systems
These systems frequently contain:
- Project budgets
- Contractor commitments
- Forecasts
- Approvals
- Invoices
- Payment histories
Documents and unstructured content
Important portfolio information often lives in:
- Lease abstracts
- Estoppels
- Lender packages
- Investment committee materials
- Inspection reports
- Deal memos
Spreadsheets
Important spreadsheet use cases include:
- Forecast models
- Variance analysis
- Asset reviews
- Budget adjustments
- Executive reporting
- Investment analysis
---
The difference between reporting and analytics
| Reporting | Analytics |
|---|---|
| Explains what happened | Explains why it happened |
| Standardized outputs | Investigation and exploration |
| Fixed metrics | Dynamic analysis |
| Recurring schedules | Ad-hoc analysis |
| Dashboard-focused | Decision-focused |
A monthly occupancy report may show that occupancy declined from 94% to 92%.
Analytics answers:
- Which properties drove the decline?
- Which tenants left?
- Was the decline temporary or structural?
- What actions are required?
The shift from reporting to analytics is ultimately a shift from visibility to investigation.
---
Why source systems matter more than dashboards
One of the most common mistakes in analytics programs is prioritizing visualization before data quality.
Dashboards cannot correct poor source data.
Common root causes include:
- Inconsistent definitions
- Duplicate entities
- Missing ownership
- Manual reconciliation
- Stale information
- Source-system conflicts
Analytics maturity therefore starts with confidence in the underlying source systems before expanding into dashboards, AI interfaces, or advanced reporting.
---
What is a source of truth in commercial real estate analytics?
A source of truth is not necessarily a single database. It is a governed framework of definitions, ownership, identities, lineage, and effective dates that allows teams to interpret portfolio information consistently.
Many firms mistakenly believe that centralizing data automatically creates a source of truth.
In reality, most reporting challenges result from:
- Inconsistent entity definitions
- Differing reporting rules
- Effective-date mismatches
- Ownership confusion
A successful source-of-truth strategy establishes:
- Entity definitions
- Ownership rules
- Effective dates
- Metric calculations
- Refresh cadence
- Lineage standards
---
Structured vs. unstructured CRE data
Structured data
Examples:
| Type | Example |
|---|---|
| Lease Records | Rent, dates, options |
| Rent Roll | Tenant, suite, area |
| Financial Records | Revenue, expenses |
| Occupancy Records | Leased area, vacancy |
| CapEx Records | Budget, commitment, spend |
Unstructured data
Examples:
- Lease agreements
- Lease abstracts
- Estoppels
- Inspection reports
- IC materials
- Property reports
- Email correspondence
Why both matter
A tenant concentration review may require both:
- Structured rent-roll records
- Unstructured lease documents
Modern CRE analytics increasingly depends on both sources working together.
[[SME: Which document types create the biggest information gap between portfolio reporting systems and real-world leasing decisions?]]
---
Data quality: the hidden determinant of analytics success
Analytics accuracy is limited by source quality.
Common CRE data quality issues
#### Duplicate entities
- ABC Corp
- ABC Corporation
- ABC Holdings
may represent the same tenant.
#### Definition conflicts
Examples:
- Physical occupancy
- Leased occupancy
- Economic occupancy
#### Effective-date confusion
Questions such as:
*"What was occupancy at quarter-end?"*
can produce multiple answers depending on date logic.
#### Missing ownership
When no owner exists for definitions, reporting disputes continue indefinitely.
Signs of data-quality problems
| Symptom | Cause |
|---|---|
| Reporting disputes | Definition conflicts |
| Manual reconciliation | Missing integration |
| Low dashboard trust | Poor lineage |
| Analyst-heavy cleanup | Weak data quality |
| Slow reporting cycles | Fragmentation |
---
The cost of fragmented data
Fragmented environments create:
Slower decisions
Teams spend time validating data rather than solving business problems.
Higher reporting effort
Analysts repeatedly reconcile information.
Reduced trust
Stakeholders question reported numbers.
Limited scalability
Portfolio growth increases complexity.
AI readiness challenges
AI depends on quality, consistency, and governance.
---
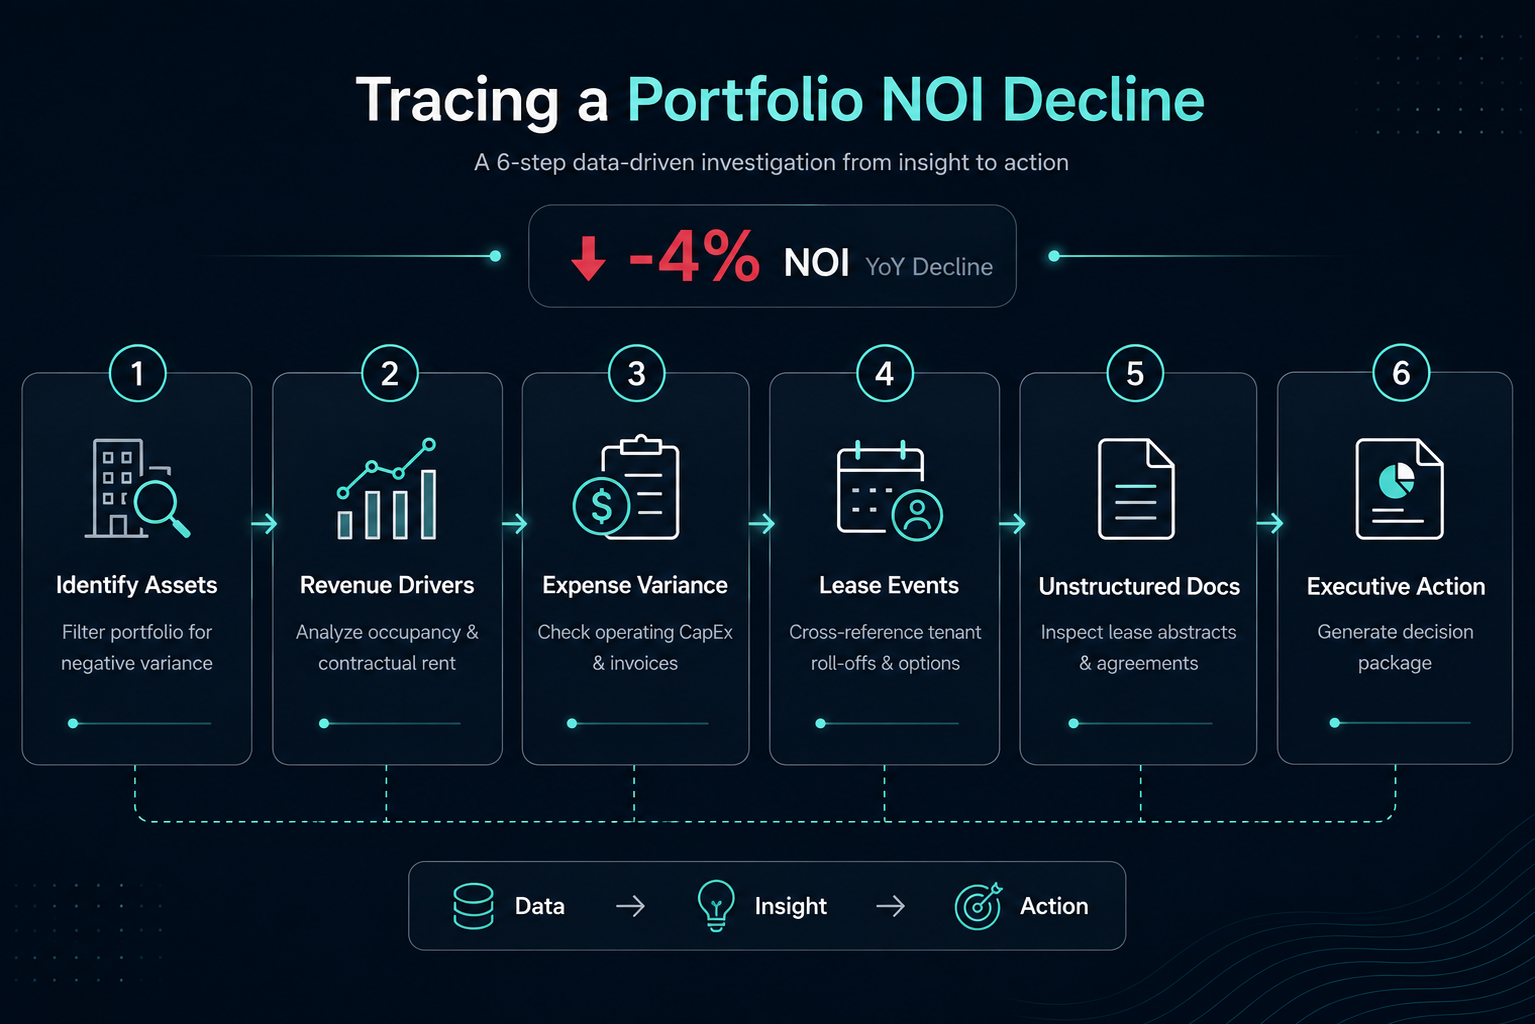
Worked example: tracing a portfolio NOI decline
Suppose NOI declines by 4%.
Step 1
Identify impacted properties.
Step 2
Review revenue drivers.
Step 3
Analyze expenses.
Step 4
Review lease events.
Step 5
Examine supporting documents.
Step 6
Create executive explanation.
Only after completing the analysis can the organization confidently answer:
- What changed?
- Why it changed?
- Which assets drove it?
- What actions are required?
---
How governance enables trustworthy analytics
Governance exists to make analytics useful.
| Governance Area | Purpose |
|---|---|
| Ownership | Accountability |
| Definitions | Consistency |
| Lineage | Explain origin |
| Access | Control visibility |
| Quality Controls | Reliability |
| Change Management | Prevent silent logic changes |
Organizations with mature governance spend less time debating numbers and more time acting on them.
---
Why AI does not eliminate data governance
AI increases the importance of governance.
If AI receives:
- Duplicate entities
- Poor quality data
- Conflicting definitions
- Missing ownership
it cannot consistently produce reliable answers.
AI improves access.
Governance determines trust.
---
The CRE Data Value Chain
Source → Standardize → Govern → Connect → Analyze → Act
| Stage | Purpose | Key Question |
|---|---|---|
| Source | Capture activity | Where does data originate? |
| Standardize | Create consistency | Is it represented consistently? |
| Govern | Establish control | Can teams trust it? |
| Connect | Integrate systems | Can systems work together? |
| Analyze | Generate insight | Can users investigate efficiently? |
| Act | Make decisions | Can findings influence outcomes? |
---
The evolution of CRE analytics in 2026
Historical workflow:
- Operational systems
- Analyst exports
- Spreadsheet modeling
- Dashboards
- Reporting
Modern workflow increasingly adds:
- Data intelligence layers
- Semantic definitions
- AI-assisted investigation
- Multi-source analytics
- Generated deliverables
The shift is not from humans to AI.
The shift is from manual gathering to faster investigation and explanation.
---
How AI fits into commercial real estate analytics
Useful AI applications include:
Finding Information Faster
Example:
Which industrial leases larger than 50,000 square feet expire within 18 months?
Investigating Performance
Example:
Which assets contributed most to the NOI decline?
Working Across Multiple Sources
Questions spanning:
- Databases
- Spreadsheets
- Documents
Producing Outputs
Generating:
- Presentations
- Reports
- Executive summaries
- Analysis packages
---
What analytics leaders should evaluate before buying technology
Evaluation Area 1: Data Foundation
- Are systems identified?
- Are definitions documented?
- Is ownership assigned?
Evaluation Area 2: Integration Readiness
- Which systems must connect?
- What refresh cadence is required?
- How much manual reconciliation exists?
Evaluation Area 3: Governance Maturity
- Who manages definitions?
- How are changes approved?
- Is lineage tracked?
Evaluation Area 4: Analytics Access
- Who needs answers?
- Which decisions require support?
Evaluation Area 5: AI Readiness
- Are definitions consistent?
- Is access governed?
- Can outputs be traced?
---
Where commercial real estate data analytics falls short
Data quality propagates downstream
Bad source data creates bad analytics.
Definitions remain subjective
Occupancy and NOI often require firm-specific interpretation.
Historical continuity is imperfect
Migrations and acquisitions create challenges.
AI does not replace expertise
Asset-management judgment remains essential.
Integration never ends
Systems constantly evolve.
[[SME: What limitation surprised stakeholders most during a real CRE analytics deployment?]]
---
Data Readiness Checklist for CRE Leaders
| Area | Key Question | Ready? |
|---|---|---|
| Data Inventory | Do we know where key data resides? | □ |
| Definitions | Are core metrics governed? | □ |
| Ownership | Does every domain have an owner? | □ |
| Integration | Are systems connected? | □ |
| Lineage | Can values be traced? | □ |
| Access | Is visibility governed? | □ |
| Reporting | Can reports be generated efficiently? | □ |
| Analytics | Can users investigate changes? | □ |
| AI Readiness | Can systems answer trusted questions? | □ |
---
What should commercial real estate leaders do next?
- Inventory portfolio data
- Define ownership
- Standardize metrics
- Connect systems
- Improve analytical access
- Expand AI and reporting capabilities
Organizations that succeed in analytics treat data as a strategic capability rather than an IT project.
---
# Frequently Asked Questions
What is commercial real estate data analytics?
Commercial real estate data analytics is the process of collecting, governing, analyzing, and interpreting portfolio information to support financial, operational, leasing, and investment decisions.
Why is CRE data analytics difficult?
Portfolio information exists across many systems with different owners, definitions, refresh cycles, and structures.
What data matters most?
Lease data, tenant records, financial information, occupancy metrics, capital projects, budgets, forecasts, debt information, and supporting documents.
Does AI replace traditional analytics?
No. AI improves access and investigation but does not replace governance, quality, or business judgment.
What is a single source of truth?
A governed framework of definitions, ownership, lineage, and business rules that creates consistent interpretation across systems.
What causes data silos?
Operational systems, spreadsheets, organizational boundaries, vendors, and inconsistent definitions.
How does governance improve analytics?
Governance creates consistency through ownership, definitions, lineage, quality standards, and controls.
Can AI search across multiple CRE data sources?
Yes, when governance, permissions, lineage, and reconciliation controls exist.
---
Turn portfolio questions into governed answers
See how Bayaan helps CRE teams connect governed business data, investigate portfolio questions, and generate trusted outputs.
Talk to BayaanCTA
Commercial real estate analytics becomes more valuable when teams can connect governed data, ask questions across systems, verify answers, and generate reports from trusted information.
Bayaan supports that workflow through natural-language access to business data, cited answers, governance controls, and generation of Word, Excel, and PowerPoint outputs.
Contact: https://www.askbayaan.com/contact/
---
#