
In this article
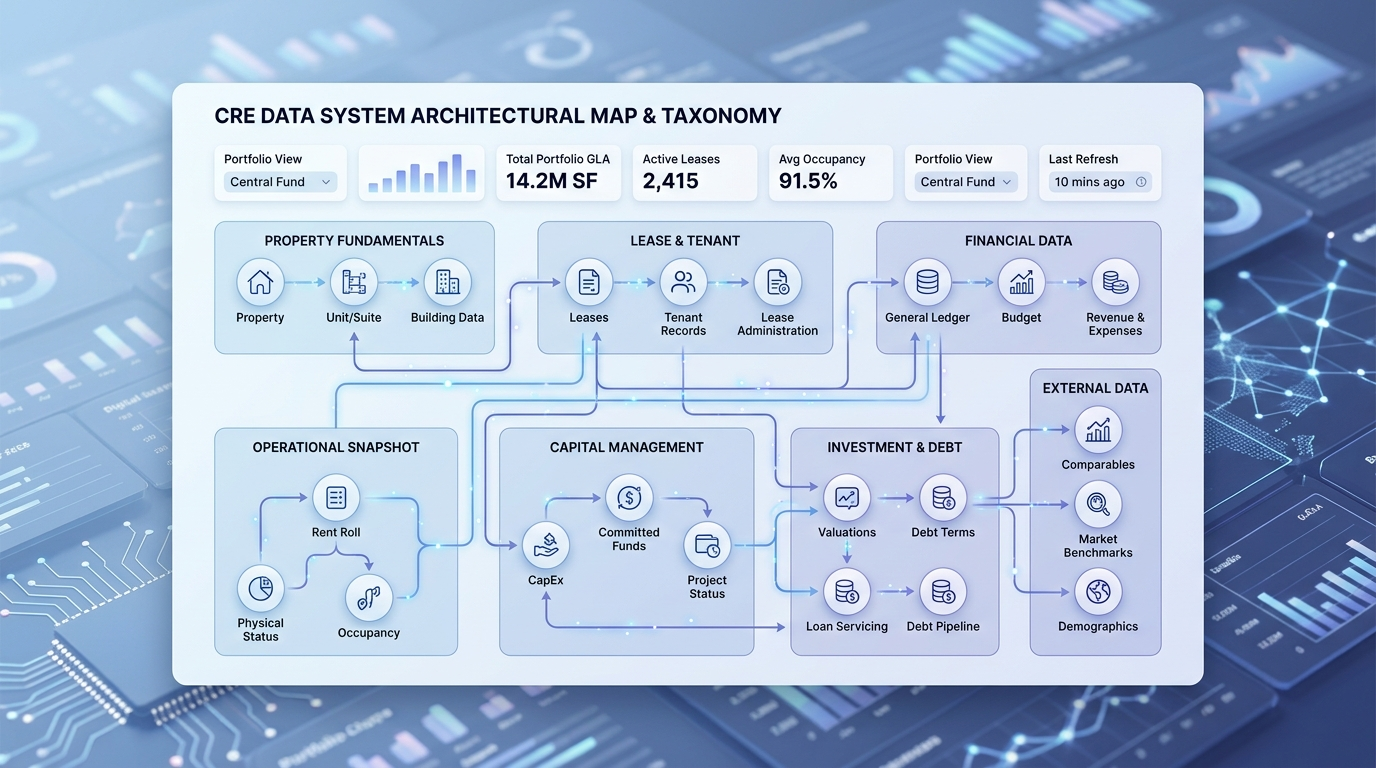
A single commercial property generates data in at least a dozen different shapes: a lease document, a rent roll line, a general ledger entry, a CapEx budget line, an occupancy snapshot, a broker's leasing pipeline note. Teams that treat all of this as one flat spreadsheet run into trouble the moment two numbers disagree. The lease says one rent amount, the rent roll says another, and nobody can say which one is current without checking the amendment history.
The reason is structural, not sloppy work. Each of these data objects has its own grain, its own owner, its own refresh cycle, and its own system of record. This article maps the full taxonomy: what each object contains, who typically owns it, how often it changes, and where teams usually keep it. Use it to inventory what exists in your own portfolio before connecting any of it to analytics or AI.
Key takeaways
- Commercial real estate data is not one dataset. It is a set of distinct objects, including leases, rent roll, GL/financials, occupancy, CapEx, valuations, debt, leasing pipeline, and documents, each with a different grain and refresh cycle.
- Grain matters more than volume: a lease is one record per agreement, while rent roll is typically one record per unit or suite per period, and GL data is one record per transaction line.
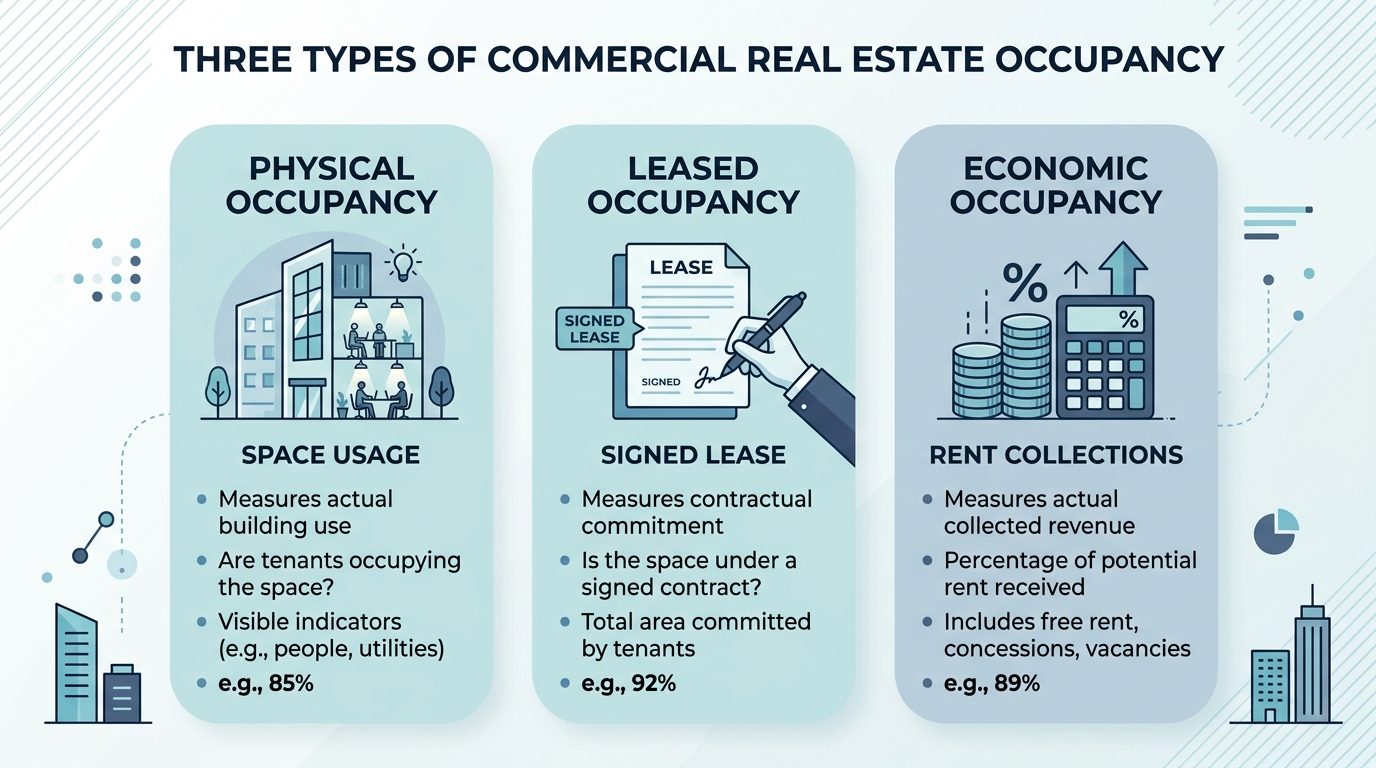
- Occupancy is not a single number. Physical, leased, and economic occupancy answer different questions and can diverge meaningfully in the same building.
- CapEx data lives across at least three states — budgeted, committed, and actual — and conflating them produces misleading spend totals.
- Structured data (GL, rent roll) behaves differently in analytics than semi-structured data (lease abstracts) or unstructured data (PDFs, emails, inspection photos).
- A usable CRE data inventory records, for every object, its grain, owner, refresh cadence, and system of record before anyone tries to connect it to a dashboard or an AI assistant.
What "commercial real estate data" actually includes
Commercial real estate data is the full set of structured, semi-structured, and unstructured records that describe a portfolio's properties, tenants, leases, financial performance, and physical condition over time. It spans systems that were never designed to talk to each other: property management software, accounting platforms, spreadsheets, document repositories, and market data feeds.
Most CRE data problems trace back to treating this collection as if it were one table. A property management system and an accounting system may both claim to hold "the" rent number for a suite, but they answer different questions at different points in the billing cycle. A lease PDF and a lease abstract in a database may disagree after an amendment that only one system has processed.
The practical fix starts with naming the objects individually rather than lumping them together as "portfolio data." The sections below walk through the object categories that matter most, followed by a framework for cataloging them.
Lease and tenant data
The lease is the foundational legal document, and lease data is what gets extracted from it: base rent, escalations, term dates, renewal options, expense responsibility (NNN, gross, modified gross), tenant improvement allowances, and free-rent periods. Tenant data sits alongside it: legal entity name, guarantor, industry classification, and often a separate record for each affiliated entity or DBA.
Grain here is one record per lease agreement, with amendments layered on as their own dated records rather than overwrites. A tenant that has renewed twice and expanded once may have four or five linked lease records feeding a single "current terms" view. Ownership typically sits with leasing or asset management, with legal maintaining the source documents.
Property, unit, and rent-roll data
Property data describes the physical asset: address, square footage, year built, building class, parking ratio, and ownership structure (including joint-venture or fund-level splits). Unit or suite data breaks that property into leasable space, each with its own square footage and current status.
Rent roll data sits on top of both. It is typically one record per unit or suite per reporting period, showing the current tenant, rent, term, and status (occupied, vacant, or under negotiation). Because it is a period snapshot rather than a running ledger, a rent roll pulled in January and one pulled in March can show different numbers for the same suite without either one being wrong. Refresh cadence is usually monthly, tied to the accounting close, though some teams regenerate it more often during active leasing pushes.
[[LINK: single source of truth]] → A13 — Commercial Real Estate Database: How to Build a Single Source of Truth
Financial data: GL, budgets, and CapEx
General ledger data is the most granular financial object in a CRE portfolio: individual transaction lines coded to property, GL account, and period. NOI, EBITDA, and most other financial metrics are calculated from GL data rather than stored as a single figure anywhere. Budget data runs parallel to it, typically at the annual or monthly level, and is compared against GL actuals to produce variance.
CapEx data deserves separate treatment because it exists in at least three states that are easy to conflate: budgeted CapEx (what was planned), committed CapEx (what has been contracted, such as a signed construction contract), and actual CapEx (what has been paid or accrued). A "CapEx spend" figure that mixes these states without labeling them will overstate or understate real cash exposure depending on which state dominates the total.
GL and budget data are usually owned by accounting and FP&A, refreshed on the accounting close cycle (commonly monthly), and held in the accounting or ERP system rather than the property management platform.
Occupancy data and why definitions diverge
Occupancy looks like a simple percentage until three different teams calculate it three different ways:
| Occupancy type | What it measures | Common source |
|---|---|---|
| Physical occupancy | Whether the space is physically in use by a tenant, regardless of lease status | Property management / operations |
| Leased occupancy | Whether the space is under a signed lease, including space not yet occupied (signed-not-commenced) | Leasing / property management |
| Economic occupancy | Rent actually being collected as a share of total potential rent (gross potential rent) | Accounting / GL |
A suite that is leased but not yet built out counts toward leased occupancy but not physical occupancy. A tenant paying reduced rent under a workout agreement can lower economic occupancy while physical and leased occupancy stay unchanged. None of the three definitions is "correct" in isolation; the question determines which one is the right lens. An analytics or AI system that reports "occupancy" without stating which type it means will produce numbers that quietly disagree with the report a different team already trusts.
[[LINK: portfolio metrics teams should track]] → A28 — Commercial Real Estate Portfolio Analysis: Metrics Every CRE Team Should Track
Valuations, debt, and leasing pipeline data
Valuation data includes appraisals, internal fair-value marks, and cap-rate assumptions, refreshed far less often than operating data, sometimes only annually or at refinancing and acquisition events. Debt data covers loan balances, maturity dates, covenants, and interest rate terms, usually owned by finance or treasury and tied to the loan servicing system.
Leasing pipeline data is different in kind from the objects above: it describes deals in progress rather than executed agreements. Stage, probability, proposed terms, and expected commencement date change frequently, often weekly, and the data typically lives in a CRM or leasing-specific tool rather than the property management system. Pipeline data should generally stay separate from rent roll and lease data until a deal executes, since blending probabilistic pipeline figures into "actual" portfolio numbers overstates current performance.
Documents and unstructured data
A meaningful share of CRE data does not arrive as rows in a table. Lease agreements, amendments, estoppels, subordination agreements, insurance certificates, inspection reports, and correspondence are documents first, and any numeric fields inside them (a rent escalation schedule buried in a lease exhibit, for example) have to be extracted before they behave like structured data.
This matters for analytics and AI because the three data shapes require different handling:
- Structured data (GL entries, rent roll rows) is already organized into consistent fields and is the easiest to query directly.
- Semi-structured data (a lease abstract, a budget template with consistent tabs) has partial structure that usually needs a mapping step before it is reliable.
- Unstructured data (PDFs, emails, scanned inspection reports) needs extraction or abstraction, and often human validation, before it can be trusted in a portfolio-wide answer.
Treating a folder of lease PDFs as equivalent to a rent-roll export is one of the most common sources of downstream error in CRE analytics projects.
Market and external data
Not every relevant data point lives inside the portfolio. Market rent comparables, submarket vacancy rates, cap-rate benchmarks, demographic data, and comparable sales are typically sourced from third-party market data providers rather than internal systems. This external data is usually the least frequently refreshed of any category discussed here, often quarterly, and it is fundamentally different from internal data because it describes the market rather than the asset. Blending internal and external data in one analysis is often useful, but the two should be clearly labeled so a reader can tell which numbers are the firm's own performance and which are a market reference point.
The CRE Data Map — Object × Grain × Owner × Refresh × System of Record
Cataloging portfolio data works better as a structured inventory than as a narrative description. The CRE Data Map lays out five dimensions for every object: what it is, its grain (the level at which one record exists), who typically owns it, how often it typically changes, and where it usually lives.
| Object | Typical grain | Typical owner | Typical refresh cadence | Typical system of record |
|---|---|---|---|---|
| Lease | One record per lease agreement (plus amendments) | Leasing / legal | Event-driven (signing, amendment, renewal) | Lease administration or property management system |
| Tenant | One record per legal entity/tenant | Leasing / asset management | Event-driven | Property management or CRM |
| Property | One record per asset | Asset management | Rarely (acquisition, disposition, renovation) | Property management system |
| Unit/suite | One record per leasable space | Property management | Event-driven (build-out, re-measurement) | Property management system |
| Rent roll | One record per unit/suite per period | Property management | Monthly (variable by firm) | Property management system export |
| GL/financials | One record per transaction line | Accounting | Monthly close cycle | Accounting/ERP system |
| Budget | One record per line item per period | FP&A | Annual, revised periodically | Accounting/ERP or planning tool |
| CapEx | One record per project, split by budget/committed/actual state | Asset management / accounting | Project-driven, reviewed monthly or quarterly | Accounting/ERP or dedicated CapEx tracker |
| Occupancy | One record per unit/period, by occupancy type | Property management / accounting | Monthly (variable by firm) | Property management system or derived calculation |
| Valuation | One record per asset per valuation event | Finance / asset management | Annual or event-driven | Internal model or appraisal file |
| Debt | One record per loan | Finance / treasury | Event-driven, reviewed monthly | Loan servicing system |
| Leasing pipeline | One record per deal | Leasing | Weekly or more frequent | CRM or leasing tool |
| Documents | One record per file | Legal / property management | Event-driven | Document repository |
| Market/external | One record per market/comp | Research / market data vendor | Quarterly (variable by provider) | Third-party data feed |
Refresh cadences above are typical patterns, not universal rules. Firm-specific practices vary by portfolio size, fund structure, and internal reporting calendar; treat the cadence column as a starting point for your own inventory rather than a fixed standard.
Data inventory worksheet
Before connecting any of these objects to a dashboard, a data warehouse, or an AI assistant, record the following for each one in your own portfolio:
- Object name — what is this data (lease, rent roll, CapEx, etc.)?
- Grain — what does one record represent?
- Owner — which team or role is accountable for its accuracy?
- System of record — where does the authoritative version live today?
- Refresh cadence — how often does it actually change, and how often is it actually updated in the system?
- Structure type — structured, semi-structured, or unstructured?
- Known conflicts — does this object disagree with any other object today, and why?
Filling this out honestly, including the "known conflicts" column, surfaces the exact places where downstream analytics will produce disputed numbers.
Where this falls short
This taxonomy describes common patterns, not a fixed standard every CRE firm follows. A few limitations are worth naming directly.
Firms define objects differently. Some property management systems calculate occupancy in ways that blend physical and leased status, and some firms track CapEx inside the same GL accounts used for operating expense, which makes the three-state budgeted/committed/actual distinction harder to apply cleanly without rework.
Fund and joint-venture structures complicate ownership. A single property can sit inside multiple ownership entities with different reporting requirements, and the "system of record" for financial data may differ depending on which entity's books are being reported.
Document-based data resists full automation. Lease abstraction and amendment tracking still typically require human review before the extracted fields are trustworthy enough for portfolio-wide analysis, particularly for older leases with nonstandard language.
[[LINK: fragmented CRE data]] → A14 — CRE Data Management: Why Real Estate Teams Struggle With Fragmented Data
Turn portfolio questions into governed answers
See how Bayaan helps CRE teams connect governed business data, investigate portfolio questions, and generate trusted outputs.
Talk to BayaanHow to use this taxonomy
- List every data object your portfolio actually generates, using the categories above as a starting checklist rather than an assumption of completeness.
- For each object, complete the data inventory worksheet fields: grain, owner, system of record, refresh cadence, structure type, and known conflicts.
- Flag any object where two systems currently disagree, and note which one should become the source of truth.
- Prioritize structured, high-frequency objects (rent roll, GL) for connection to analytics first, since they carry the lowest integration cost.
- Treat document-based and unstructured objects as a separate workstream that needs abstraction and validation before they feed automated reporting.