
In this article
Ask three people on a CRE team for last quarter's occupancy rate and it is common to get three different answers, none of them wrong exactly, just built from different exports, pulled on different days, using different definitions of occupied. Nobody set out to create that mess. It accumulated one spreadsheet, one system migration, and one departing analyst at a time.
Fragmentation is not primarily a technology problem, even though it shows up as one. It persists because CRE data crosses teams, vendors, asset types, ownership structures, and reporting cycles, and no single group is accountable for the whole picture. This article covers what fragmentation actually looks like in a CRE operation, why it keeps recurring even after a system upgrade, and a scorecard for diagnosing where your own team's friction is coming from.
Key takeaways
- Fragmentation is usually an ownership and definition problem wearing a technology costume. New software rarely fixes it without also fixing who is accountable for each data object.
- The most common fragmentation patterns are duplicate spreadsheets, disconnected point systems, and inconsistent exports, not a single missing integration.
- A data dictionary, a shared, written definition for each metric and object, resolves more disputes than a new dashboard does.
- Handoffs between property management, asset management, finance, and leasing are where fragmentation is introduced most often, because each team optimizes its own workflow first.
- Close-cycle reconciliation catches many fragmentation problems late, after the numbers have already been used in a report. Earlier data-quality checks catch them before that happens.
- Governance has to be a recurring cadence, not a one-time cleanup project, or the same fragmentation reappears within a year.
What CRE data fragmentation actually looks like
CRE data fragmentation is the condition where the same real-world fact, a rent amount, an occupancy status, a CapEx total, exists in multiple places with values that do not agree, and no one is clearly responsible for reconciling them. It is different from simply having many systems. Multiple systems are normal in CRE; fragmentation is what happens when those systems are not kept in sync and no process exists to catch the drift.
It shows up as small, everyday friction long before it becomes a crisis: an analyst spending an afternoon reconciling a rent roll export against the GL before a board meeting, a leasing update that never made it into the reporting spreadsheet, a metric that means one thing in the asset management deck and another thing in the investor report. None of these individually looks like a data emergency. Together, they define how much of a CRE team's time goes to reconciliation instead of analysis.
Common fragmentation patterns
A few patterns recur across CRE operations regardless of portfolio size:
- Parallel spreadsheets. A property management export gets copied into a working spreadsheet that then diverges from the source system as manual edits accumulate.
- Disconnected point systems. Leasing uses a CRM, accounting uses an ERP, and property management uses its own platform, with data moving between them through periodic manual exports rather than a live connection.
- Inconsistent exports. The same report pulled by two different people, or on two different days, uses different filters, date ranges, or occupancy definitions without either person realizing it.
- Orphaned local knowledge. An analyst who understood exactly how a legacy spreadsheet's formulas worked leaves the firm, and the logic behind a long-standing number becomes unclear to everyone who remains.
- Unreconciled amendments. A lease amendment gets signed and filed but takes weeks to be reflected in the rent roll, during which every report using rent roll data is quietly out of date.
None of these require bad intent. They are the predictable result of teams working fast inside disconnected tools without a shared source of truth or a process to keep the pieces aligned.
Ownership and stewardship
Fragmentation persists partly because it is genuinely unclear who owns a given number. Does property management own occupancy, or does asset management, since asset management is the one reporting it externally? Does accounting own NOI, or does asset management, since asset management defines which line items count?
Effective data stewardship assigns a named owner, not just a department, to each core object: rent roll, GL/financials, occupancy, CapEx, leasing pipeline. That owner is accountable for the accuracy of the data at its source and for flagging known discrepancies, even if they are not the one entering every transaction. Without a named owner, a data quality issue tends to sit unaddressed because everyone assumes someone else is watching it.
Data dictionaries and shared definitions
A data dictionary is a written, agreed definition for each metric and data object: what fields it draws from, what it includes and excludes, and who maintains it. For CRE teams, the highest-value entries are usually the ones with the most room for disagreement: NOI, occupancy (physical, leased, or economic), same-store performance, and CapEx categorization.
Without a shared dictionary, definitions live in people's heads and in the formulas of whichever spreadsheet happens to be in use, which means the definition can change unintentionally every time a new analyst builds a new version of the report. A dictionary does not need to be elaborate. A short, versioned document naming the owner, the formula or logic, and the source fields for each core metric resolves a disproportionate share of "why don't these two reports match" conversations.
Handoffs between property management, asset management, finance, and leasing
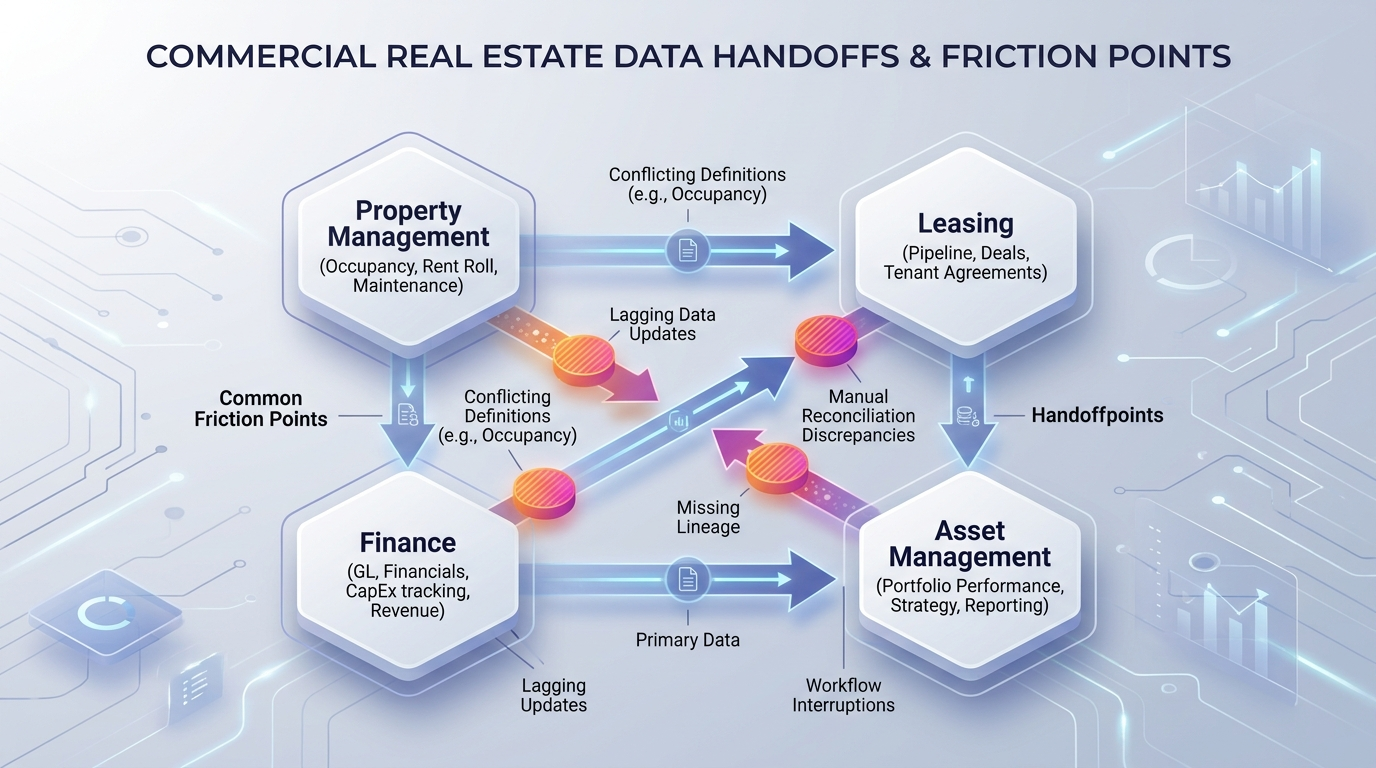
Most fragmentation is introduced at the handoff points between teams, not within any single team's own process. Property management captures occupancy and rent roll data operationally, day to day. Leasing tracks pipeline deals that have not yet executed. Finance owns the GL and closes the books on a fixed monthly cycle. Asset management sits in the middle, consuming data from all three to build the reporting view that goes to ownership or investors.
Each team optimizes its own workflow first, which is reasonable, but it means data gets reshaped, filtered, or summarized differently as it crosses each boundary. A rent roll exported for property management's internal use might exclude signed-not-commenced leases that leasing considers essential for pipeline reporting. A GL export for asset management might use a chart-of-accounts grouping that does not map cleanly to the categories property management uses for CapEx tracking. Mapping these handoffs explicitly, and agreeing what data crosses each boundary and in what form, closes more gaps than adding another system.
Close-cycle reconciliation and data quality controls
Close-cycle reconciliation is the practice of checking, at each accounting close, that rent roll, GL, and budget figures agree where they are supposed to, and documenting any variance with a reason. Done consistently, it catches drift before it compounds into a reporting error that reaches an investor or lender.
The limitation is timing: reconciliation at close catches problems after the fact, once a month's data is largely finalized. Earlier data-quality controls, such as flagging a rent roll export that shows a suite as vacant while the leasing system shows a signed lease for it, catch the same class of problem days or weeks sooner, before it works its way into a report. Mature CRE data management combines both: ongoing lightweight checks during the month, and a formal reconciliation step at close.
Governance cadence
Fragmentation reappears within a year of any cleanup project that does not build in a recurring governance cadence. A workable cadence does not need to be heavy:
- Monthly: Review reconciliation variances from the close cycle and confirm they were resolved, not just noted.
- Quarterly: Revisit the data dictionary for any metric that generated a definitional dispute during the quarter, and update the documented definition if the team's understanding has genuinely changed.
- Annually: Reassign or reconfirm data ownership as roles and org structure change, since ownership silently lapses when people change teams or leave.
The specific cadence matters less than the fact that it exists on a calendar and has a named owner, rather than depending on someone noticing a problem and raising it informally.
The Data Friction Scorecard
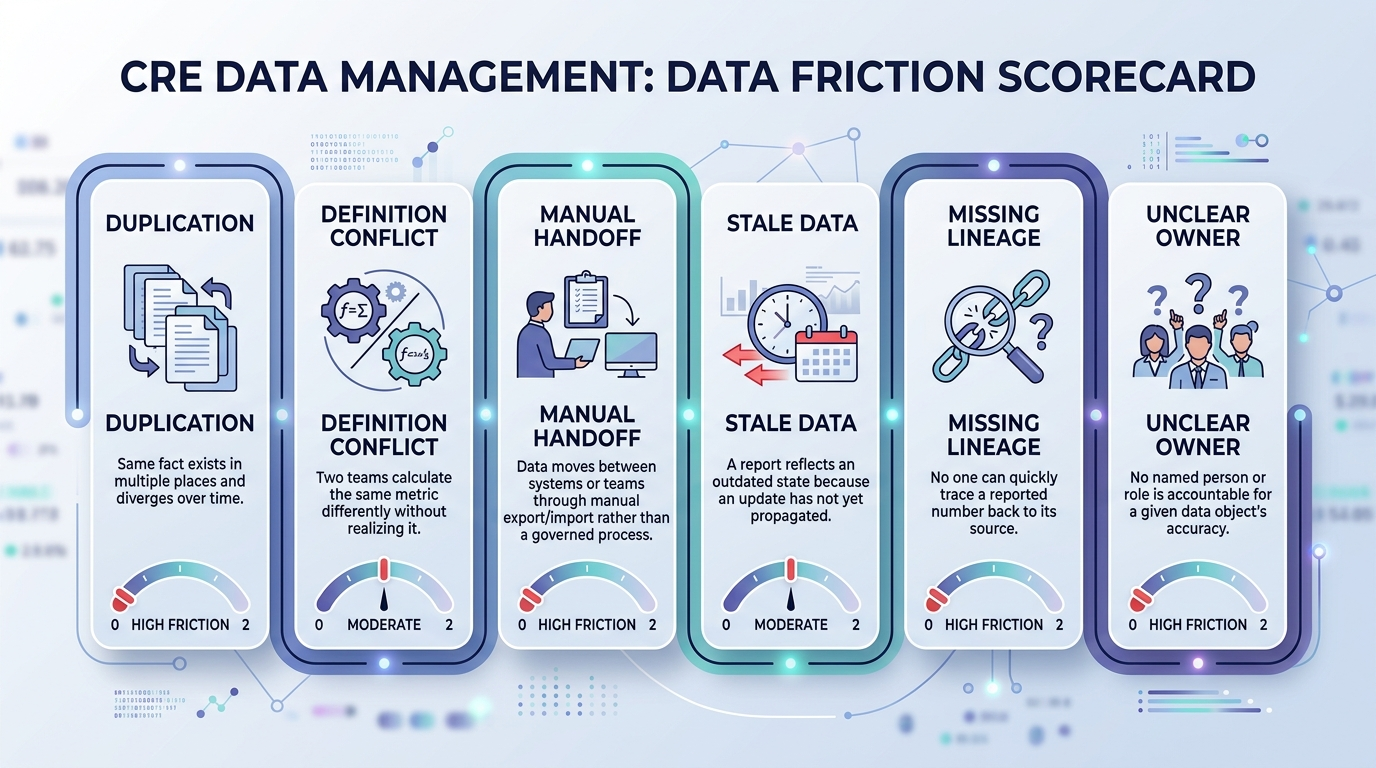
Data fragmentation is easier to diagnose when it is broken into distinct sources of friction rather than treated as one undifferentiated problem. Score your team from 0 (frequent, unmanaged) to 2 (rare, well-controlled) on each dimension:
| Friction type | What it looks like | Score (0–2) |
|---|---|---|
| Duplication | The same fact exists in multiple places and diverges over time | |
| Definition conflict | Two teams calculate the same metric differently without realizing it | |
| Manual handoff | Data moves between systems or teams through manual export/import rather than a governed process | |
| Stale data | A report reflects an outdated state because an update has not yet propagated | |
| Missing lineage | No one can quickly trace a reported number back to its source | |
| Unclear owner | No named person or role is accountable for a given data object's accuracy |
A team scoring low across most dimensions has a genuine data management problem worth a structured project. A team scoring low on one or two specific dimensions can often address those directly, for example building a data dictionary to fix definition conflict, without a full overhaul.
Worked example
An asset management team notices that its quarterly occupancy figure does not match the number leasing reported to ownership the same week. Running the scorecard: duplication scores low (two separate exports exist), definition conflict scores low (leasing used leased occupancy, asset management used physical occupancy), manual handoff scores low (the leasing figure was emailed as a static number rather than pulled from a shared source), and the other three dimensions score reasonably well. The fix is targeted: align on which occupancy definition each report uses and document it, rather than replacing either team's underlying system.
Where this falls short
Data management discipline reduces fragmentation. It does not eliminate the underlying complexity that causes it.
Ownership assignments do not survive org changes automatically. When a role is restructured or a person leaves, data ownership can lapse silently unless the annual governance step actively catches it, which means the scorecard needs to be revisited, not just filled out once.
A data dictionary only helps if it is actually consulted. Documentation that lives in a file nobody opens does not resolve definitional disputes any better than no documentation at all; it has to be built into the reporting workflow itself.
Process fixes do not substitute for connected systems. A well-run manual handoff is still slower and more error-prone than a governed system-to-system connection, so data management discipline is a necessary complement to integration work, not a replacement for it.
Turn portfolio questions into governed answers
See how Bayaan helps CRE teams connect governed business data, investigate portfolio questions, and generate trusted outputs.
Talk to BayaanHow to start reducing data friction
- Run the Data Friction Scorecard across your core data objects (rent roll, GL, occupancy, CapEx, leasing pipeline) to identify which specific friction types are driving the most rework.
- Assign a named owner to each object that currently lacks one.
- Draft data dictionary entries for the two or three metrics that generate the most disagreement, starting with occupancy and NOI if they are contested.
- Map the handoff points between property management, asset management, finance, and leasing, and agree what data crosses each boundary and in what form.
- Put a governance cadence on the calendar, even a lightweight monthly and quarterly version, with a named owner for the cadence itself.