
In this article
A commercial real estate team can have a property-management system, a lease-administration system, a general ledger, dozens of Excel workbooks, and several executive dashboards, yet still spend days reconciling a basic portfolio question. That usually means the firm is missing a layer in its data stack, not necessarily another dashboard.
A data warehouse stores and models data for analysis. A business intelligence tool presents predefined analysis through dashboards and reports. A broader CRE data platform coordinates capabilities such as integration, metadata, business definitions, governance, access, analytics, and delivery. These categories can overlap, but they solve different primary problems.
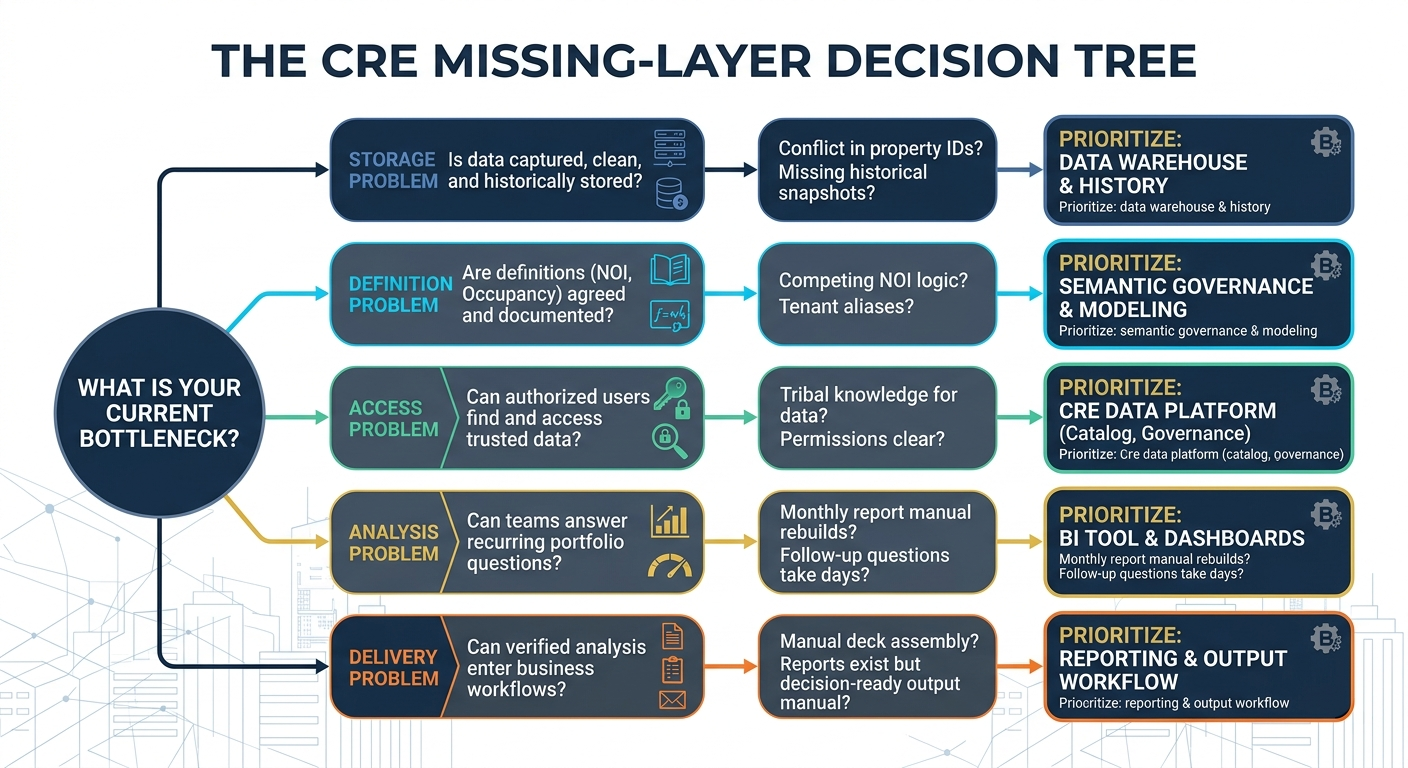
This guide compares the three categories across storage, transformation, semantic definitions, governance, dashboards, ad-hoc analysis, AI access, and operational use. It also provides a decision tree for identifying whether your current bottleneck is storage, definition, access, analysis, or delivery.
Key takeaways
- A data warehouse centralizes, transforms, and models data so lease, rent-roll, occupancy, general-ledger, budget, and CapEx information can support consistent analysis.
- A BI tool turns prepared data into dashboards, charts, scorecards, and recurring reports for questions that teams already know they need to monitor.
- A CRE data platform is a broader operating layer that may coordinate integration, metadata, semantic definitions, governance, search, analytics, AI access, and delivery workflows.
- These categories usually coexist. A platform may use a warehouse for storage and expose governed data to BI, analytics, AI, and reporting experiences.
- Buying the wrong layer leaves the original problem intact. A dashboard cannot repair conflicting NOI definitions, and a warehouse alone does not guarantee business-user access.
- The best starting point is the Missing-Layer Decision Tree: storage problem → definition problem → access problem → analysis problem → delivery problem.
What is a CRE data platform?
A CRE data platform is a coordinated environment for connecting, governing, understanding, accessing, analyzing, and using commercial real estate data across operational and analytical workflows. The term is broad, and vendors do not always use it consistently, so buyers should evaluate actual capabilities rather than rely on the label.
A platform may span several functions:
- Connections to operational databases, APIs, scheduled exports, files, or shared analytical models
- Metadata describing datasets, fields, owners, refresh status, and lineage
- Semantic definitions for NOI, occupancy, rent exposure, lease expiration, CapEx states, and portfolio hierarchies
- Permission controls across funds, joint ventures, regions, properties, and sensitive fields
- Search, query, exploration, and cross-system analytics
- Delivery into dashboards, reports, PowerPoint, Excel, Word, or supported business workflows
A platform does not necessarily replace the source systems where property operations, accounting, leases, budgets, and projects are maintained. It often sits above those systems and coordinates how their information becomes trustworthy and usable.
For the broader category and capability stack, see What Is a Data Intelligence Platform for Commercial Real Estate? (A17).
What is a data warehouse in commercial real estate?
A data warehouse is a centralized analytical repository that collects, transforms, and models data from multiple systems. Its primary job is to create stable, queryable structures for historical analysis and reporting.
In a CRE firm, a warehouse may receive information from:
- Property-management and accounting systems
- Lease-administration databases
- Rent-roll exports
- Budget and forecast workbooks
- Occupancy snapshots
- CapEx project systems
- Valuation, debt, or external datasets where licensed and approved
The warehouse may standardize property identifiers, tenant aliases, lease records, account mappings, reporting periods, and entity hierarchies. It can preserve history that operational systems overwrite or do not expose conveniently.
A warehouse is especially valuable when a question crosses systems or periods. For example, calculating a portfolio-level NOI trend may require actuals from the general ledger, approved property mappings, same-store inclusion rules, and a consistent period calendar. The warehouse can model those relationships once rather than forcing each analyst to rebuild them in Excel.
A warehouse does not automatically create agreement about business definitions. It can store multiple NOI variants or occupancy measures, but people still need to approve which definition applies to each report. It also does not guarantee an intuitive interface for asset managers or executives.
For source-of-truth concepts, effective dates, identity resolution, and lineage, see Commercial Real Estate Database: How to Build a Single Source of Truth (A13).
What is a BI tool in commercial real estate?
A business intelligence tool is an interface for presenting and exploring prepared data through dashboards, charts, tables, scorecards, filters, and scheduled reports. BI tools are strongest when the audience, metric, and recurring question are already known.
Common CRE BI use cases include:
- Monthly actual-versus-budget NOI monitoring
- Physical, leased, or economic occupancy dashboards
- Lease-expiration schedules by year, asset, market, or tenant
- CapEx budget, commitment, spend, and forecast tracking
- Tenant concentration and rollover exposure
- Property-level operating summaries
- Executive portfolio scorecards
BI tools can make recurring analysis faster and more consistent. An asset-management team can review the same occupancy or NOI dashboard each month instead of rebuilding the view manually.
The limitation appears when the user asks a new question that the dashboard was not designed to answer. A dashboard showing occupancy by property may not explain which suites, lease commencements, move-outs, or denominator changes drove the variance. A new visual, model adjustment, or analyst investigation may still be required.
For the separate interface comparison between conversational analysis and dashboards, see AI Chatbot vs. BI Dashboard for Commercial Real Estate (A07).
CRE data platform vs. data warehouse vs. BI tool
The following comparison focuses on each category’s primary role. Individual products may span more than one column.
| Capability | CRE data platform | Data warehouse | BI tool |
|---|---|---|---|
| Primary purpose | Coordinate governed data use across workflows | Store, transform, and model analytical data | Present and explore prepared analysis |
| Operational source storage | Usually not the primary system of record | No, typically receives copies or modeled data | No |
| Analytical storage | May include or use it | Core capability | Usually relies on another layer |
| Data ingestion and integration | Often included or coordinated | Common pipeline destination | Limited |
| Transformation and modeling | Often supported | Core capability | Light calculations and presentation logic |
| Historical tracking | Depends on architecture | Strong fit | Consumes available history |
| Metadata and catalog | Often central | May be present | Usually limited to reports and models |
| Semantic definitions | Often governed across tools | Can encode them in models | Can encode report-level measures |
| Data lineage | Often coordinated end to end | Strong within modeled pipelines when implemented | Usually focused on report dependencies |
| Role and entity permissions | Often coordinated across access experiences | Enforced in data models and access layers | Enforced in reports, datasets, or semantic models |
| Dashboards and scorecards | May include or connect to them | Not the primary interface | Core capability |
| Ad-hoc business exploration | Often a major capability | Usually requires technical query access | Moderate, bounded by the model and report design |
| Natural-language or AI access | May be included | Provides governed data foundation | May offer interface features depending on product |
| Document and unstructured access | May coordinate it | Not a traditional warehouse strength | Usually limited |
| Operational workflow support | Broader potential | Limited | Primarily viewing, sharing, and report workflows |
| PowerPoint, Excel, or Word delivery | May support connected delivery workflows | Supplies data | Often exports or feeds reporting processes |
| Typical users | Data, technology, analysts, asset managers, finance, executives | Data engineers, analytics engineers, technical analysts | Business users, analysts, managers, executives |
| Main failure mode | Broad scope without clear ownership or use case | Well-modeled data that remains hard to use | Attractive dashboards built on disputed data |
The categories should not be treated as mutually exclusive. A firm might maintain operating systems, replicate approved data into a warehouse, govern definitions and access through a broader platform, and use BI for recurring portfolio monitoring.
Worked example: Which assets drove the quarterly NOI decline?
Assume an executive asks:
Which assets contributed most to the portfolio’s NOI decline this quarter, and what were the main revenue or expense drivers?
The three layers contribute different parts of the answer.
What the warehouse contributes
The warehouse can assemble property-level actuals, budget values, account mappings, reporting periods, entity hierarchies, and approved same-store flags. It can preserve prior-quarter values and ensure property identifiers align across source systems.
Without that foundation, an analyst may need to export general-ledger data, map accounts manually, reconcile property names, and determine which assets belong in the comparison.
What the BI tool contributes
The BI layer can show portfolio NOI, period variance, asset ranking, and drill-down into revenue and expense categories. It gives executives and asset managers a repeatable way to monitor the same measures each reporting cycle.
If the dashboard already contains the necessary hierarchy and measures, users can move from portfolio to property and account category quickly.
What the data platform contributes
The broader platform can make the approved NOI definition discoverable, expose data ownership and lineage, apply permissions, support ad-hoc querying, and coordinate delivery into a report or executive artifact. It can also help a user find adjacent evidence, such as approved commentary or portfolio-review material, if those sources are connected and governed.
Where human review remains necessary
The stack can identify that repairs, vacancy, recoveries, or another account category changed. It cannot automatically establish the operational cause unless the relevant evidence exists and the interpretation is reviewed. A financial variance may reflect timing, reclassification, accruals, lease events, or a genuine operating change.
Why CRE firms often buy the wrong layer
Technology selection often starts with a visible symptom. The team then buys the category associated with that symptom without diagnosing its root cause.
| Visible symptom | Likely root problem | Layer to investigate first |
|---|---|---|
| Two dashboards show different occupancy | Competing definitions, filters, or effective dates | Semantic governance and data modeling |
| Analysts spend days assembling monthly reports | Fragmented sources and manual delivery | Warehouse/integration plus reporting workflow |
| Executives cannot answer follow-up questions | Access or ad-hoc analysis gap | Platform/self-service analytics |
| Historical rent roll cannot be reconstructed | Missing snapshots or slowly changing records | Warehouse and historical model |
| Users cannot find the approved dataset | Discovery and metadata gap | Platform/catalog |
| Property and tenant names do not match | Identity-resolution problem | Shared data model/master data |
| Dashboard totals do not reconcile to accounting | Source mapping or transformation problem | Warehouse and reconciliation controls |
| Data is available but not trusted | Ownership, lineage, and governance problem | Governance across platform and data models |
| Analysis exists but decks remain manual | Delivery and reporting workflow gap | Reporting/output layer |
| AI answers are fluent but unverifiable | Provenance, semantic, or access-control gap | Governed platform and AI connection architecture |
A dashboard project cannot fix conflicting occupancy definitions by itself. A warehouse project cannot guarantee that asset managers can find and understand the approved data. A platform project cannot repair incorrect source records without stewardship and remediation.
The Missing-Layer Decision Tree
Use the Missing-Layer Decision Tree to diagnose the first constraint worth addressing.
1. Is the required data captured and historically available?
No: Start with the source systems, extraction process, historical snapshots, or warehouse foundation.
Questions to test:
- Are lease amendments, rent steps, occupancy snapshots, budget versions, and CapEx states captured?
- Can the team reconstruct prior-period values?
- Are property, tenant, lease, suite, fund, and joint-venture identifiers stable?
If the answer is no, additional dashboards will only present an incomplete record.
2. Do teams agree on definitions and entity scope?
No: Prioritize the semantic and governance layer.
Questions to test:
- Which NOI definition is approved for this use?
- Does occupancy mean physical, leased, or economic occupancy?
- Which assets belong in same-store analysis?
- Are unconsolidated joint ventures included?
- Is tenant exposure measured by annual base rent, total rent, area, or another basis?
A warehouse can encode approved rules, while a broader platform can make those rules discoverable and reusable.
3. Can authorized users find and access trusted information?
No: Prioritize catalog, metadata, permissions, discovery, and self-service access.
A data platform is often the missing layer when approved data exists but users do not know where it is, what it means, or how to request it. Access must also respect fund, joint-venture, property, region, and field-level restrictions.
4. Can the organization answer recurring questions consistently?
No: Prioritize BI dashboards, scorecards, and standardized reports after the underlying definitions are stable.
Recurring questions include:
- What is current occupancy by portfolio and property?
- Which leases expire in the next 12, 24, or 36 months?
- Where is NOI below budget?
- Which CapEx projects are over forecast or behind schedule?
BI is a strong fit when the question, audience, cadence, and visual are predictable.
5. Can users investigate new questions without rebuilding reports?
No: Prioritize ad-hoc analysis, governed query access, search, conversational analytics, or platform capabilities.
The organization may already have dashboards but still depend on analysts for every follow-up. This is an access and analysis problem rather than a storage problem.
6. Can verified analysis become a decision-ready deliverable?
No: Prioritize reporting, collaboration, and output workflows.
The stack may produce the right number but still require manual PowerPoint, Excel, or Word assembly. The missing layer is delivery rather than storage or visualization.
How the three layers coexist in a modern CRE stack
A simplified architecture may look like this:
``text Operational CRE Systems and Files Property management | GL | Lease data | Rent roll | Budgets | CapEx | Documents ↓ Integration and Data Pipelines ↓ Data Warehouse or Governed Analytical Store Identity | History | Transformations | Reconciliation | Shared Models ↓ Data Platform and Governance Layer Catalog | Semantics | Lineage | Permissions | Search | Query | Workflow ↓ BI, Analytics, AI, and Reporting Experiences Dashboards | Ad-hoc analysis | Cited answers | PowerPoint | Excel | Word ↓ Asset Management, Finance, Leasing, Reporting, and Executive Decisions ``
This diagram is a conceptual pattern, not a mandatory sequence. A smaller firm may use curated databases and files rather than a formal warehouse. A larger organization may operate several warehouses, lakehouses, BI environments, and domain platforms. The design should follow business requirements, data sensitivity, existing investments, and operational ownership.
For the controlled path between AI and enterprise data, see How to Connect an AI Assistant to Commercial Real Estate Data (A16).
When should a warehouse be the priority?
A warehouse should be considered first when the organization lacks a consistent analytical history or shared model.
Strong indicators include:
- Property, tenant, lease, and suite identifiers differ across systems.
- Prior-period rent rolls or occupancy snapshots cannot be reconstructed.
- Account mappings vary by property manager or ownership entity.
- Analysts repeatedly combine exports before every portfolio review.
- Budget, actual, commitment, spend, and forecast values cannot be reconciled.
- Same-store membership and effective dates are recreated in spreadsheets.
- Cross-system queries are slow, risky, or impractical against operational databases.
A warehouse project should define reconciliation controls, historical behavior, grain, effective dating, lineage, and ownership. Centralizing inconsistent data without resolving those issues simply moves inconsistency into a new location.
When should a BI tool be the priority?
A BI tool should be considered first when trusted, modeled data already exists but recurring information is difficult to consume.
Strong indicators include:
- Executives receive static spreadsheets for the same KPIs each month.
- Asset managers manually create the same occupancy, NOI, leasing, or CapEx views.
- Teams need visual filtering and drill-down across approved dimensions.
- Report distribution is inconsistent.
- Leadership cannot monitor exceptions between formal reporting cycles.
BI is valuable for repeated monitoring. It is less effective when the organization has not defined the metric, connected the source, or preserved the necessary grain and history.
When should a broader CRE data platform be the priority?
A broader platform should be considered when the firm has multiple data capabilities but cannot coordinate their use.
Strong indicators include:
- Users cannot locate the approved dataset or report.
- Metric definitions are buried in documentation or individual knowledge.
- Permissions differ across source, warehouse, BI, and AI experiences.
- Analysts act as the access layer for every new question.
- Business users need structured and unstructured information in one workflow.
- Lineage, data freshness, and ownership are not visible.
- Verified analysis is difficult to turn into business-ready output.
A platform initiative should remain use-case-led. A broad platform without a prioritized workflow can become another technical layer that business teams do not adopt.
What this comparison cannot decide for you
Product boundaries are not consistent
One vendor may call its offering a data platform while another markets overlapping capabilities as a warehouse, lakehouse, analytics cloud, or intelligence platform. Evaluate architecture, controls, and user workflows rather than category names.
Existing investments change the answer
A firm with a mature analytical store may not need another warehouse. A firm with strong BI may still lack semantic governance or ad-hoc access. The correct priority depends on what already works.
Centralization is not automatically a single source of truth
Moving lease, occupancy, budget, and financial data into one repository does not resolve tenant aliases, effective dates, disputed metrics, or source precedence. Those require explicit modeling and ownership.
Dashboards cannot explain every variance
A dashboard can reveal that NOI or occupancy changed. Determining why may require lease records, account detail, budget assumptions, asset commentary, or human investigation.
Platforms do not eliminate stewardship
Metadata, permissions, definitions, lineage, and quality controls change over time. Owners must maintain them as properties, funds, joint ventures, users, and reporting requirements change.
AI does not remove the underlying layers
Natural-language access can make data easier to query, but accurate answers still depend on governed sources, definitions, permissions, query validation, freshness, and provenance.
Turn portfolio questions into governed answers
See how Bayaan helps CRE teams connect governed business data, investigate portfolio questions, and generate trusted outputs.
Talk to BayaanHow should CRE buyers evaluate the current stack?
Use this scorecard before creating a vendor shortlist. Rate each statement Red, Amber, or Green.
| Area | Diagnostic statement | Red signal | Likely priority |
|---|---|---|---|
| Storage | We preserve the history required for portfolio analysis | Prior values cannot be reconstructed | Warehouse/history |
| Identity | Property, tenant, lease, suite, fund, and JV entities reconcile | IDs and names conflict | Shared model/master data |
| Definitions | Approved metric definitions are documented and reusable | Reports use competing logic | Semantic governance |
| Discovery | Users can find the approved dataset and owner | Knowledge is tribal | Platform/catalog |
| Permissions | Access follows portfolio and field sensitivity | Manual exceptions or leakage risk | Governance/access layer |
| Recurring analysis | Standard KPIs are available in repeatable views | Monthly manual report rebuild | BI |
| Ad-hoc analysis | Authorized users can investigate follow-ups | Every new question enters a queue | Platform/self-service |
| Lineage | Users can trace values to source and transformation | Numbers cannot be reconstructed | Warehouse/platform governance |
| Delivery | Approved analysis can become decision-ready output | Manual deck and workbook assembly | Reporting workflow |
| Operations | Failures, refreshes, and changes have owners | Issues are discovered by users | Observability and stewardship |
A practical selection sequence
- Choose one business workflow, such as monthly NOI review, lease-expiration exposure, occupancy diagnostics, or CapEx variance analysis.
- Map the required sources, grain, history, definitions, permissions, analysis steps, and final output.
- Mark which capabilities already exist and which fail.
- Use the Missing-Layer Decision Tree to identify the first constraint.
- Evaluate products against that constraint rather than against the longest feature list.
- Test the workflow with representative assets, permissions, edge cases, and review steps.
- Confirm who will own data quality, definitions, access, and ongoing changes after launch.