
In this article
An analyst pulls a rent roll from Yardi, an occupancy report from a property manager's PDF, and a budget export from the accounting system, then spends most of a day rebuilding the same variance workbook the portfolio review needs every month. The rollup breaks the first time someone edits a hidden column, and by the time the numbers reach the meeting, nobody remembers which version is current.
AI can now generate a version of that workbook from a prompt or an uploaded template: a rent-roll summary, a budget-to-actual variance tab, a property rollup ready for a portfolio review. The harder question is whether the file that comes out is something a finance or asset-management team can actually rely on, or a polished-looking export that hides where the numbers came from.
This article is part of a broader guide to AI reporting for commercial real estate and focuses specifically on what AI produces in Excel: the difference between a formula and a pasted value, and the checks a workbook needs to pass before anyone downstream trusts it.
Key takeaways
- AI can generate CRE workbooks such as rent-roll summaries, variance tabs, and property rollups from a prompt or an uploaded template, but their reporting value depends on which cells hold live formulas and which hold hard-coded values.
- Field audits compiled by the European Spreadsheet Risks Interest Group (EuSpRIG) have found that more than 90% of spreadsheets in active business use contain at least one error, a risk that carries into AI-generated workbooks unless outputs are checked the same way analyst-built models are.
- A 2025 Alteryx survey of 1,400 global analysts found that 76% still rely on spreadsheets for data preparation and 45% spend more than 6 hours a week cleansing data before analysis starts — the exact bottleneck AI-generated reporting is meant to shorten.
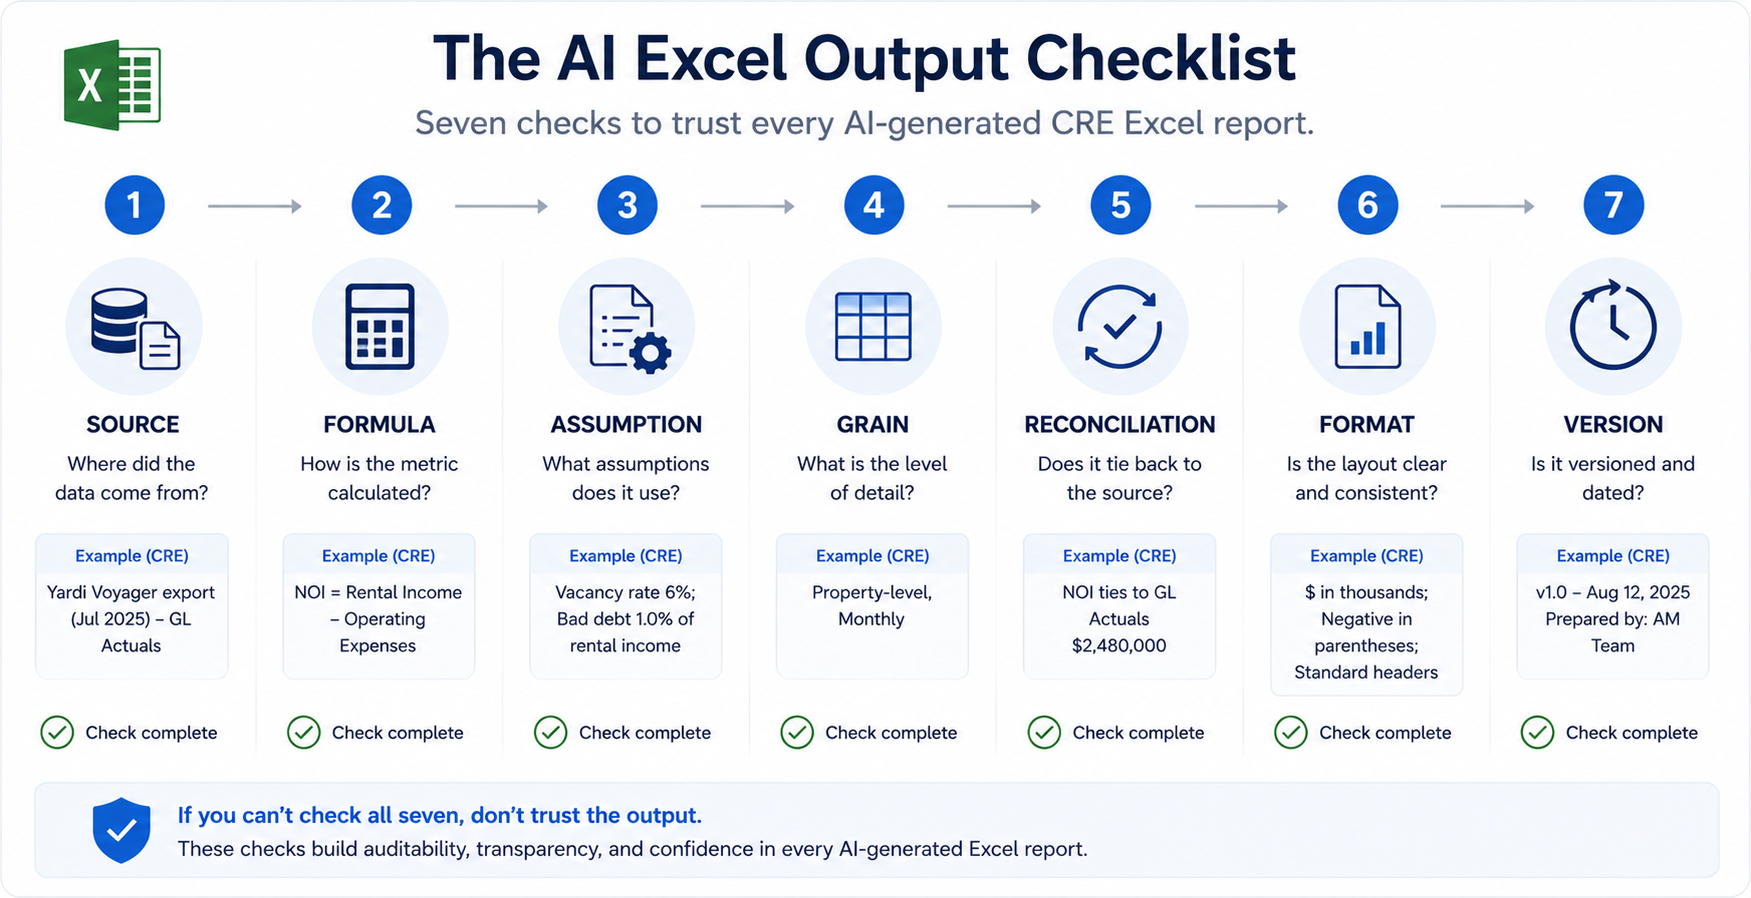
- A workbook worth trusting needs seven things in place: a traceable source, a working formula instead of a pasted value, a documented assumption, a consistent data grain, a reconciliation check, firm-standard formatting, and a version record.
- Rollups fail most often when a workbook mixes reporting grains, such as combining leased-square-foot data with unit-count data, without flagging the mismatch.
- Generated workbooks still need human review before use in investor, lender, or lease-decision contexts, the same standard applied to models built by hand.
What Is an AI-Generated CRE Excel Report?
An AI-generated commercial real estate Excel report is a workbook produced from a natural-language prompt or an uploaded template that pulls values from connected portfolio data — leases, rent roll, general ledger (GL), budgets, CapEx schedules — and arranges them into the schedules, variance tabs, or rollups a finance or asset-management team already recognizes.
That definition hides the part that actually matters: producing something that looks like a report is easy. AI models are good at matching a table layout, applying consistent formatting, and filling cells with numbers that appear correct. Producing a workbook someone can audit six months later, when a lender or an investor asks where a number came from, is a different and harder problem.
The gap between those two outcomes comes down to what's behind each cell. A workbook where every total is a live formula referencing a connected data source behaves like a spreadsheet a skilled analyst would build: it updates, it can be traced, and an error shows up as a broken reference instead of a silently wrong number. A workbook where the AI has computed the answer and pasted in a static value looks identical on screen and behaves nothing like it. That distinction, more than formatting or polish, is what determines whether an AI-generated CRE workbook belongs in a real reporting workflow or stays a one-off convenience file.
What Kinds of CRE Workbooks Can AI Actually Produce?
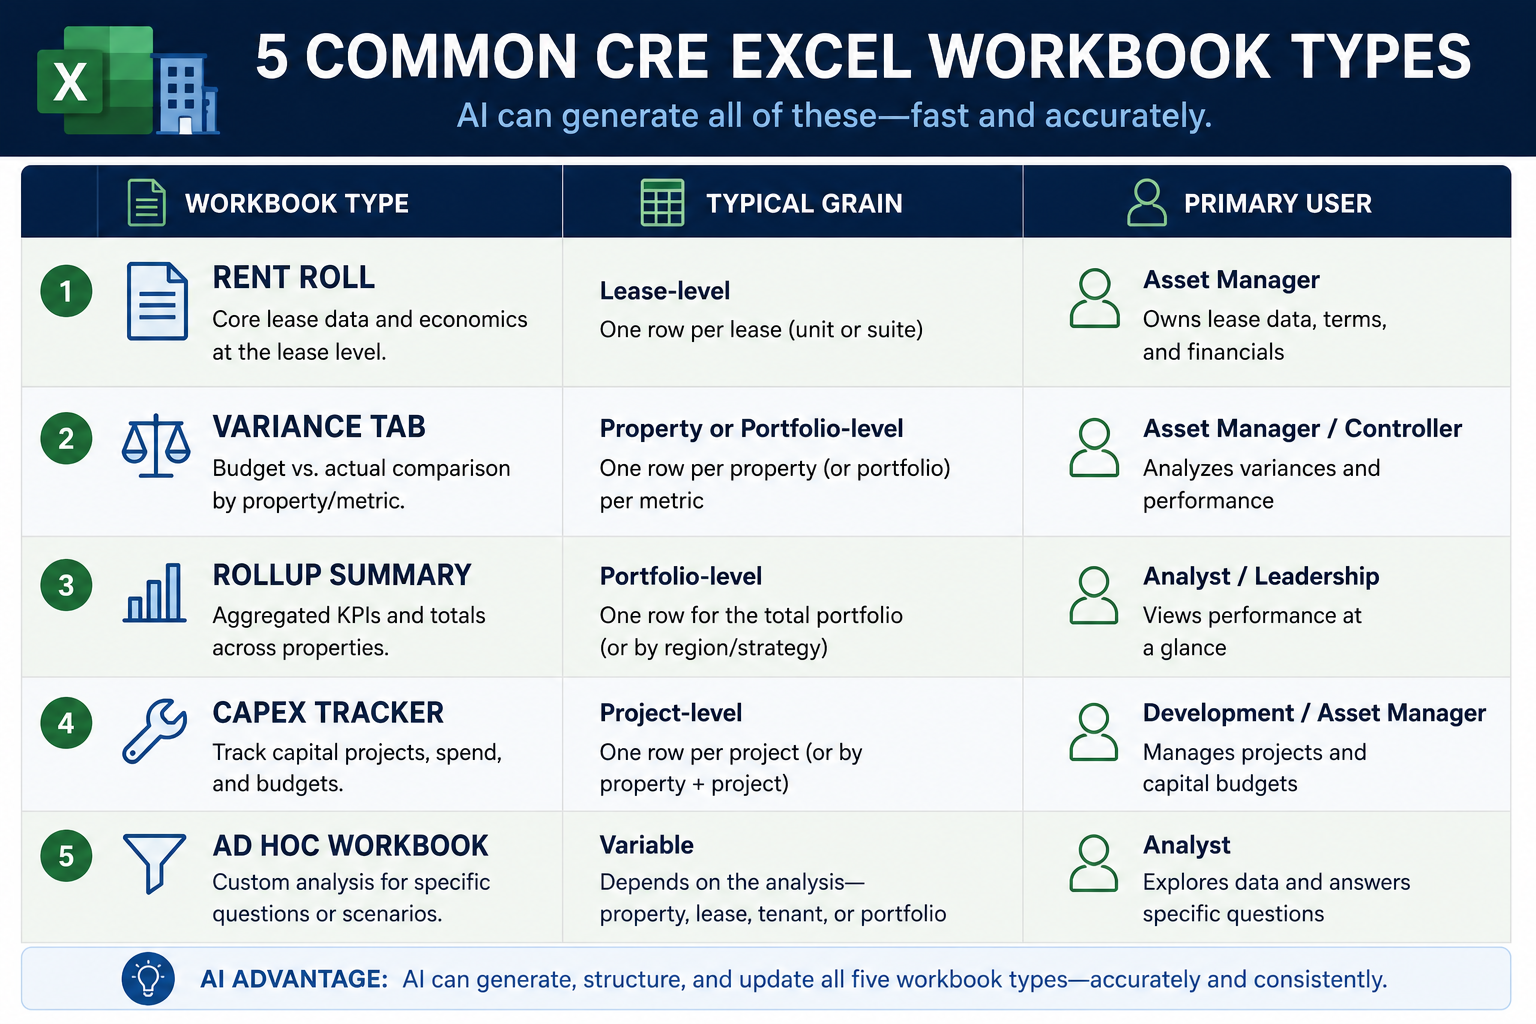
Most requests for an "Excel report" in commercial real estate fall into a small number of recurring shapes. The table below covers the ones a finance or asset-management team typically asks AI to build, along with the grain each one has to hold consistently to stay useful.
| Workbook type | What it shows | Primary user | Typical grain |
|---|---|---|---|
| Rent roll / lease schedule | Tenant, suite, lease dates, rent steps, renewal options | Leasing, asset management | Suite / lease |
| Budget-to-actual variance tab | Planned vs. actual figures by account, property, and period | Finance, asset management | GL account / property / month |
| Property or portfolio rollup | An aggregated metric such as NOI, occupancy, or CapEx across assets | Executives, investors | Property → portfolio |
| CapEx tracker | Committed, spent, and forecast amounts by project | Asset management, finance | Project / property |
| Ad hoc analysis workbook | A one-off question turned into a working file with supporting detail | Analyst, requester | Set by the question |
Each shape fails in its own way. A rent roll breaks when lease dates or option periods are pulled inconsistently across systems. A variance tab breaks when budget and actual figures use different account mappings. A property or portfolio rollup built around NOI carries its own definitional issues, covered separately in using AI to analyze NOI across a CRE portfolio, and a CapEx tracker carries a different set, covered in using AI to analyze CapEx budgets and property-level spending. Knowing which shape a request maps to determines what "correct" even means for that file.
Formulas vs. Static Values: The Difference That Decides Whether You Can Trust the File
Ask an AI system to "build a variance tab comparing budget to actual CapEx by property for the second quarter," and there are two very different ways it can answer.
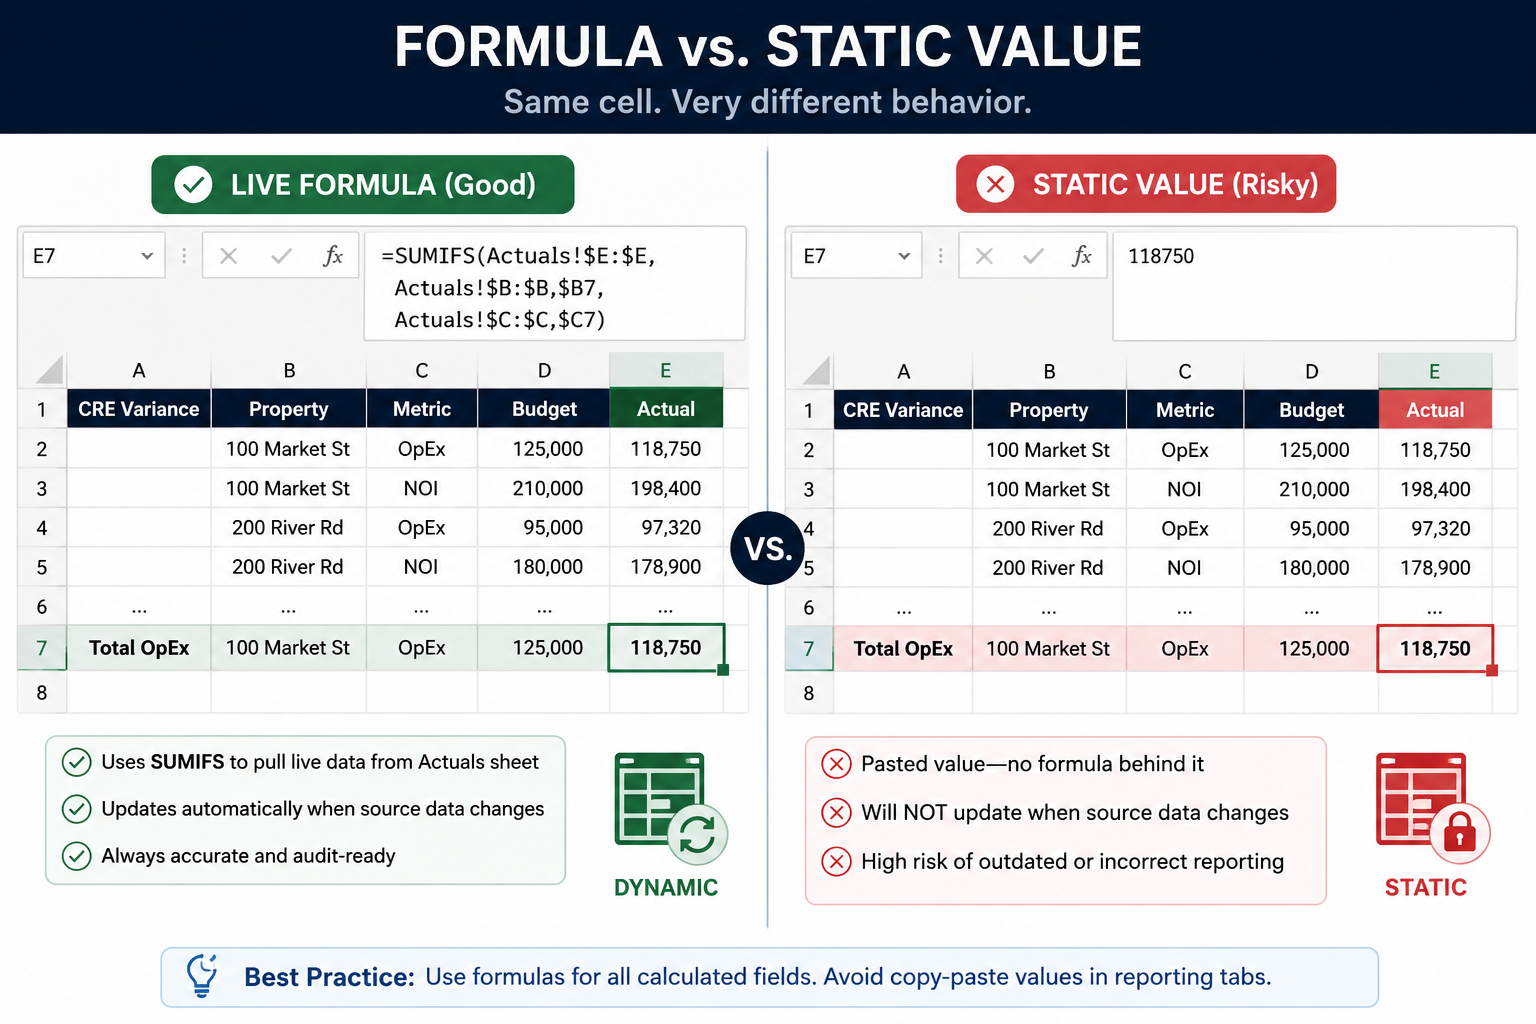
In the first version, the workbook contains a live formula in each variance cell, something equivalent to =SUMIFS(Actuals, Property, B2, Period, "Q2")-SUMIFS(Budget, Property, B2, Period, "Q2"), referencing named ranges or tables that point back at the connected data. When the underlying CapEx data updates, refreshing the workbook (or regenerating it, depending on the workflow) changes the numbers. If a referenced range moves or a source field gets renamed, the formula throws a visible error instead of quietly returning the wrong figure.
In the second version, the AI computes the same comparison internally and pastes the resulting number into the cell. The workbook looks identical. It opens the same, prints the same, and passes the same casual glance in a meeting. But it is now a snapshot, not a report. It won't update. It won't error when something changes upstream. And because nothing distinguishes a formula-driven cell from a pasted one at a glance, a reviewer has to click into every cell to find out which kind of workbook they're actually holding.
This is the single highest-leverage thing to check before trusting an AI-generated CRE workbook: click into a handful of populated cells and see whether the formula bar shows a calculation or a flat number. A workbook that's mostly static values isn't necessarily wrong today, but it's guaranteed to go stale the first time source data changes and nobody notices.
Where Do Source References and Assumptions Need to Live in the Workbook?
A number without a traceable source is a claim, not data. That's true whether an analyst typed it in three years ago or AI generated it an hour ago, but it matters more with AI output because the reviewer has no memory of building the file to fall back on.
A workbook built for real reporting use needs two things a purely visual export skips: a way to trace each figure back to its source system and as-of date, and a place where assumptions that aren't pulled from source data get stated explicitly rather than folded silently into a formula. In practice, that often means a dedicated assumptions tab listing anything manually set — a cap rate, an allocation percentage, a held-for-sale flag — alongside a source or footnote column, sometimes a hidden helper column, recording which system, table, and pull date each figure came from.
Without that layer, an AI-generated workbook can be entirely correct on the day it's produced and completely unauditable a month later, when someone asks why a number changed and nobody, human or AI, can reconstruct the answer.
How Does AI Match Your Firm's Excel Template, Formatting, and Reporting Grain?
AI matches a firm's Excel template and grain only when both are made explicit; it doesn't infer an unwritten house style. Commercial real estate teams rarely want a generic spreadsheet. They want a workbook that matches the one finance already uses: the same tab order, the same color coding for actuals versus forecast, the same locked cells, the same sign convention for expenses. A generated report that ignores those conventions creates work instead of saving it, because someone still has to reformat it before it can go into a board deck or an investor package.
Template fidelity is only half the problem. The other half is grain, meaning the level of detail each row or rollup represents. A portfolio rollup that combines properties reporting occupancy by leased square footage with properties reporting by unit count will produce a number that looks like a single consistent metric and isn't one. The same problem shows up when a CapEx tracker mixes committed amounts from one system with paid amounts from another without labeling which is which. AI doesn't resolve grain mismatches on its own; it needs the mapping defined, the same way a data or finance team would define it for a manually built model.
What Happens to the Workbook When Source Data Refreshes?
It depends on how the workflow is built. Some AI-generated workbooks refresh in place when source data changes; others regenerate as a new file each time. This is where AI-generated reporting diverges most from a one-time export, and it's worth answering with a specific rule instead of an assumption.
Both approaches are workable, but only if the behavior is explicit and consistent. Refresh-in-place is convenient until someone has added manual notes or adjustments to the previous version, which then get overwritten without warning. Regenerate-as-new-version avoids that risk but only helps if the workbook carries a version identifier and a short record of what changed, so a reviewer isn't left comparing two files with the same name and no way to tell which is current.
Firms that treat every generated workbook as disposable, rebuilt fresh each time from scratch, tend to avoid this problem entirely. Firms that expect generated workbooks to persist and get manually adjusted over time need to decide on a versioning rule before the first report goes out, not after the second one contradicts the first. For the broader reporting cycle this fits into, see how AI can create investor-ready CRE reports.
The AI Excel Output Checklist
Seven checks determine whether an AI-generated CRE workbook is ready for a reporting workflow or still a draft. None of them require deep technical skill to run; they require actually opening the file and looking.
| Checkpoint | What to verify |
|---|---|
| Source | Every figure traces to a named system, table, or file, with an as-of date attached. |
| Formula | Cells that should update contain live formulas, not pasted values; anything intentionally static is labeled as such. |
| Assumption | Manual inputs — cap rates, allocations, flags — are stated on the sheet, not hidden inside a formula. |
| Grain | The reporting grain — property, suite, GL account, period — stays consistent across every tab and rollup. |
| Reconciliation | Totals tie out to the source system, or the workbook flags exactly where and why they don't. |
| Format | The file follows the firm's template conventions: tab order, locked cells, color coding, sign convention. |
| Version | The workbook carries a version identifier and a short record of what changed since the previous one. |
A workbook that fails even one of these can still be useful as a draft. It shouldn't move into an investor package, a board deck, or a lender submission until all seven hold.
What This Approach Still Can't Do Reliably
AI-generated Excel reporting has real limits, and they're worth naming specifically rather than in general terms.
It can't resolve inconsistent metric definitions on its own. "Occupancy" can mean physical, leased, or economic occupancy depending on who's asking, and a workbook that reports a single occupancy number without specifying which one has just moved an old spreadsheet argument into a newer-looking file.
It can't protect against upstream formula fragility. A workbook that references other linked files inherits the same risk manually built models carry: if a source file's column order or structure changes, formulas can break, or worse, keep calculating against the wrong column without an obvious error.
It can't catch grain mismatches unless someone builds the reconciliation check that would surface them. A rollup can add unit-level and lease-level figures together, produce a total that looks plausible, and be wrong in a way that only shows up if someone actually reconciles it against the source systems.
And it doesn't remove the need for sign-off. A workbook intended for investor, lender, or legal use still needs review from someone with authority over the numbers. AI-generated output is a draft layer that moves faster than building a workbook from scratch, not an approval layer that replaces one.
Make workbook output auditable
Generate reporting workbooks from governed data while preserving sources, formulas, and version history.
Talk to BayaanHow to Evaluate an AI-Generated CRE Workbook Before You Trust It
Before relying on any AI-generated Excel report for real reporting work, run through a short evaluation rather than taking the output at face value.
- Open one output file and trace three numbers back to their source system manually. If you can't, the workbook isn't ready for use beyond a quick reference.
- Ask what happens when source data changes: does the file refresh in place, or does a new version get generated? Get a direct answer, not an assumption.
- Check whether assumptions are visible on the sheet itself, not buried inside a formula only the AI could reconstruct.
- Confirm the workbook respects the same access controls as the underlying data. A generated file shouldn't expose figures a viewer wouldn't otherwise be permitted to see.
- Compare the formatting against your firm's actual template, not a generic one, before assuming it's ready to forward.
Teams that skip this evaluation tend to find out the hard way, usually when a number in a board deck doesn't match the source system and nobody can explain why in the meeting. If the deliverable you actually need is a deck rather than a workbook, see how AI can automate CRE executive presentations instead.