
In this article
A finance analyst finishes a variance analysis on Tuesday. The number is right. The insight is right. And then two more days go into pulling that number into a slide, matching last quarter's template, writing commentary that sounds like the last five quarters' commentary, and reconciling which version is the one the CFO actually approved. The bottleneck in most CRE reporting cycles is rarely the analysis. It's the handoff between a verified answer and a finished deliverable someone can send to an investor, lender, or board.
This article maps that handoff end to end: what the reporting lifecycle actually looks like, where AI genuinely reduces the work, where a person has to stay involved, and what makes a generated report defensible rather than just fast. Format-specific detail on PowerPoint, Excel, and asset-management report structure lives in the articles this one leads to.
Key takeaways
- The CRE reporting bottleneck usually sits in the handoff from verified analysis to finished deliverable, not in the analysis itself: extracting numbers, writing narrative, matching templates, and reconciling versions.
- AI reporting works best when it is broken into five distinguishable stages: analysis, narrative, formatting, review, and distribution, each with a different mix of automatable, assisted, and human work.
- Investor-ready, asset-management, and internal reports carry different tolerances for polish, definitional precision, and review depth, and treating them identically produces either over-engineered internal memos or under-reviewed investor decks.
- A defensible generated report preserves provenance through every step: the source citation behind a number needs to survive translation into a slide, a cell, or a paragraph, not just live in the original answer.
- According to Deloitte's 2026 Commercial Real Estate Outlook, the share of CRE firms citing technical or data-related implementation challenges with AI rose from 16% in the prior year to 27% this year, underscoring that data structure, not model quality, is usually the limiting factor.
- No part of this workflow should be sold as fully autonomous investor reporting; materiality judgment, tone, and final sign-off stay with a person before anything reaches an investor, lender, or board.
What "AI reporting" means for a CRE team
AI reporting, in a CRE context, is the use of governed AI to move verified portfolio data through the stages between an analyst's answer and a finished, distributable deliverable — a PowerPoint deck, an Excel workbook, a Word memo, or a recurring package sent on a schedule. It is not a synonym for a dashboard. A dashboard displays live metrics; it does not write the narrative, match the brand template, or produce something a portfolio manager can attach to an email without further editing.
The category exists because the reporting bottleneck in most CRE teams is rarely the math. Variance calculations, occupancy roll-ups, and NOI trends are well-understood problems that spreadsheets already handle. What consumes days is translating a verified number into a document that looks and reads like it belongs in the firm's existing reporting package — same fonts, same table structure, same commentary voice, same distribution list — and doing that reliably every quarter without losing track of which draft is final.
AI reporting done well shortens that translation step while keeping every number traceable back to its source. Done poorly, it produces confident-sounding narrative attached to numbers nobody can verify, which is a worse outcome than a slow manual process, because it looks finished when it isn't.
The CRE reporting lifecycle, staged
Treating "reporting" as one undifferentiated task is where automation claims tend to overreach. Breaking the lifecycle into five stages makes it clear where AI genuinely helps and where a person needs to stay in the loop.
| Stage | What happens | Where AI typically helps | What stays human |
|---|---|---|---|
| Analysis | Pulling current figures, calculating variance, identifying drivers | Assembling numbers and flagging the largest movers automatically | Judgment calls on metric definitions and what counts as material |
| Narrative | Writing commentary that explains what changed and why | Drafting a first-pass explanation from verified inputs | Tone, strategic framing, and how sensitive results get characterized |
| Formatting | Matching the firm's template, charts, and layout conventions | Populating slides, tables, and charts from structured data | Final visual quality check against the actual template in use |
| Review | Checking accuracy, tying figures back to source, catching anomalies | Surfacing inconsistencies between the draft and the source data | Sign-off and accountability for what goes out under the firm's name |
| Distribution | Packaging the final version and sending it to the right recipients | Assembling the distribution package on a set schedule | Deciding who receives what, and confirming access controls are correct |
The analysis stage is the one most already-automated tools handle well. The narrative and formatting stages are where AI reporting adds the most new capability, because they used to require the most manual, repetitive human effort. The review and distribution stages should stay largely human-owned regardless of how good the drafting gets underneath them.
Investor-ready, asset-management, and internal reporting aren't the same job
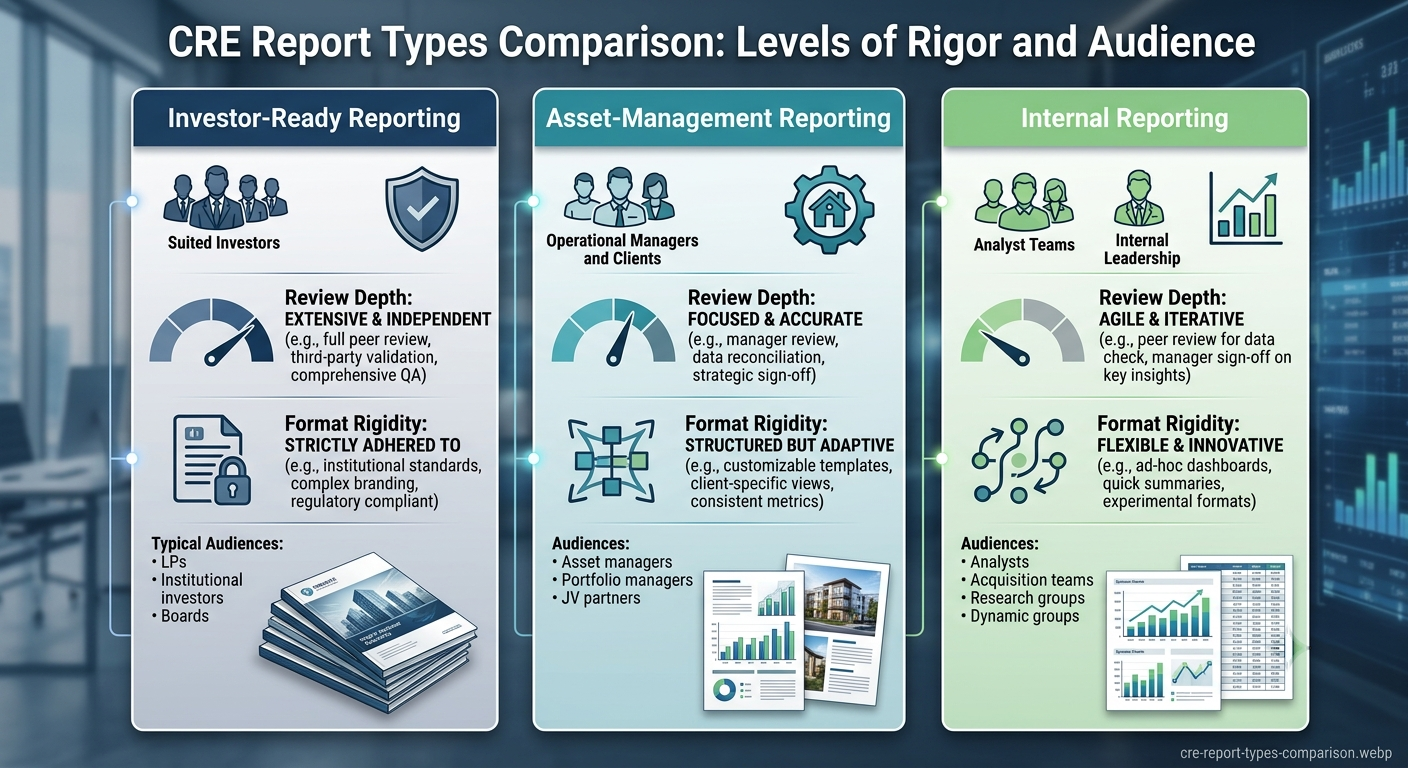
Not every CRE report needs the same level of polish or the same review depth, and building one reporting workflow that treats them identically usually produces the wrong outcome in both directions.
Investor-ready reporting — quarterly letters, capital call notices, distribution memos — carries fiduciary weight. Every figure needs to tie out to the fund's official books, the narrative needs legal and compliance review before it goes out, and the format typically follows a fixed, firm-approved template with little room for variation. Asset-management reporting sits one level down: internal audiences like portfolio managers and the investment committee, still numbers-driven, but with more tolerance for iteration and less need for polished prose. Internal reporting — a quick property-level update for a Monday meeting — needs to be accurate and fast far more than it needs to be beautifully formatted.
The mistake that shows up most often is applying investor-grade review overhead to internal reports, which slows teams down for no real benefit, or applying internal-report casualness to investor deliverables, which is where compliance problems start. AI reporting should compress production time at every tier, but the review rigor attached to each tier should not change just because a draft appears faster.
From data to PowerPoint, Excel, and Word
Each output format carries its own translation problem, and the detail is significant enough that each gets its own dedicated treatment elsewhere in this pillar. At the overview level, three things determine whether AI-generated output is usable without a full manual rebuild.
Template fidelity is the first and most common failure point: a generated slide or workbook that technically contains the right numbers but doesn't match the firm's actual fonts, color palette, table structure, or chart style creates more editing work than starting from a blank template would. Second, structural consistency matters more in Excel than in a slide deck — a workbook needs formulas, not just static values, if an analyst is going to trust and extend it afterward. Third, narrative voice consistency matters most in Word and PowerPoint commentary, where five quarters of reports written in five different tones reads as sloppy even if every number is correct.
[[LINK: turning verified analysis into board-ready slides]] covers the PowerPoint-specific workflow in depth, and [[LINK: turning CRE data into Excel workbooks and analysis]] covers the same problem for spreadsheet output.
Why static dashboards aren't the finish line
A dashboard is not a substitute for a finished deliverable, and conflating the two is a common source of frustration for reporting teams. Dashboards are built to monitor a small set of predefined metrics continuously; they are not built to answer a specific question a board member asks mid-meeting, to carry a narrative explanation of what changed and why, or to be attached to an email as a standalone document.
Dashboards also assume the viewer already knows what to look for. A board member reviewing a quarterly package needs the headline, the driver, and the recommendation stated plainly — not a set of charts they have to interpret themselves under time pressure. AI reporting exists to close that gap: it takes what a dashboard can show and turns it into something a recipient can read start to finish without a live walkthrough. [[LINK: why static dashboards aren't enough for CRE reporting]] goes deeper into where dashboards genuinely fall short and where they remain the right tool.
Versioning, citations, and what makes a report defensible
A generated report is only as trustworthy as its ability to answer two questions after the fact: where did this number come from, and which version is the one that actually went out. Both requirements get harder, not easier, once AI can produce multiple draft variations quickly.
Source citations need to survive translation across formats. A number that carries a clear citation in a conversational answer is not automatically traceable once it's been pasted into a PowerPoint slide or an Excel cell — the citation has to be preserved as the data moves through formatting, or the deliverable loses the one thing that made the original answer trustworthy. Versioning needs the same discipline: every revision should be saved as a distinct, steppable version rather than overwritten, so a reporting team can show exactly what changed between the draft a portfolio manager reviewed and the version that reached an investor. [[LINK: why source citations matter for CRE data]] covers the governance side of this requirement in more depth.
The Answer-to-Artifact Pipeline
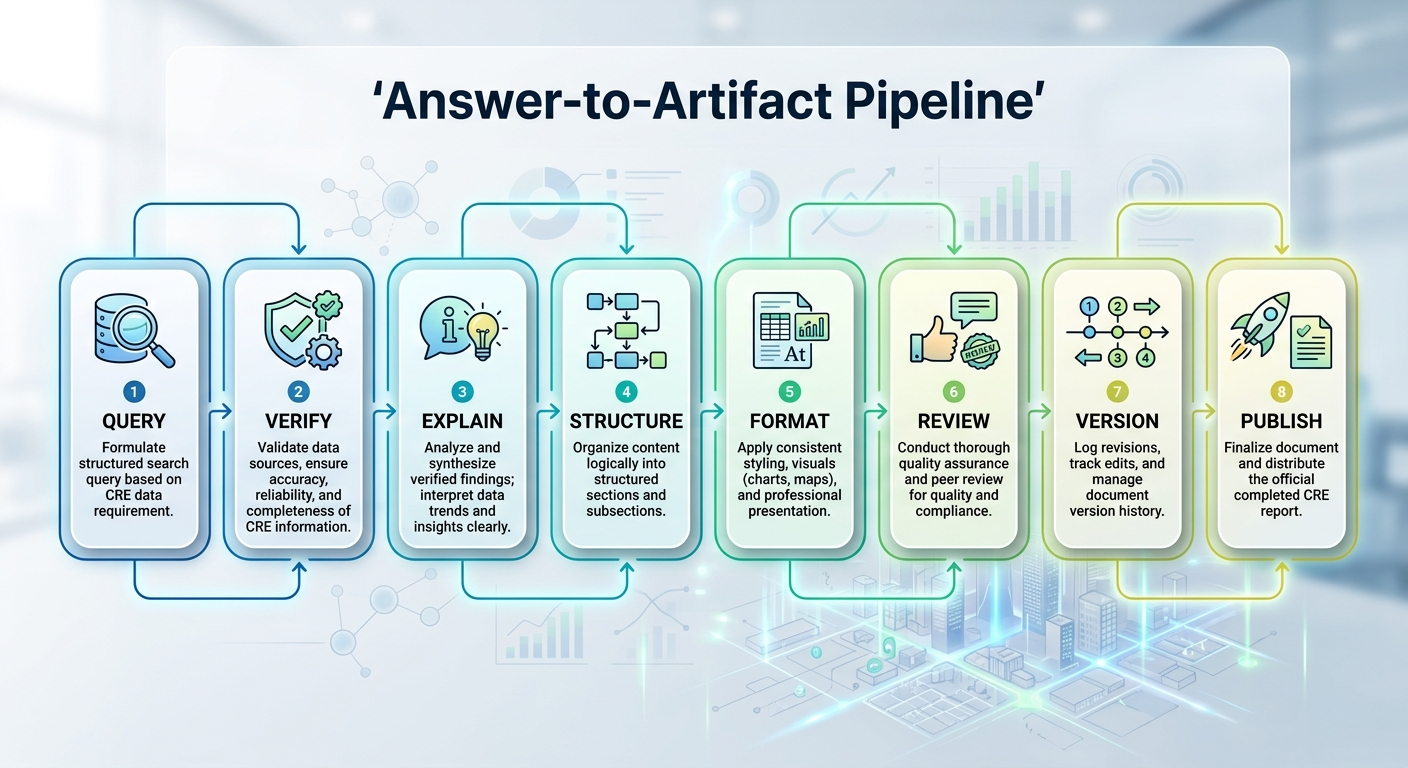
Turning a verified data answer into a finished deliverable is not one step; treating it as one step is how provenance gets lost along the way. The Answer-to-Artifact Pipeline breaks the handoff into eight stages.
- Query — the specific question being answered: what changed, for which properties, over what period.
- Verify — confirming the underlying data ties out to the source system before anything gets drafted.
- Explain — identifying the driver behind the number, not just the number itself.
- Structure — organizing the verified answer into the shape the deliverable needs: slide sections, workbook tabs, memo headings.
- Format — applying the firm's actual template, chart style, and layout conventions.
- Review — a human check for accuracy, tone, and materiality before anything moves toward distribution.
- Version — saving the reviewed draft as a distinct, traceable version rather than overwriting the prior one.
- Publish — distributing the final version to the correct recipient list with access controls intact.
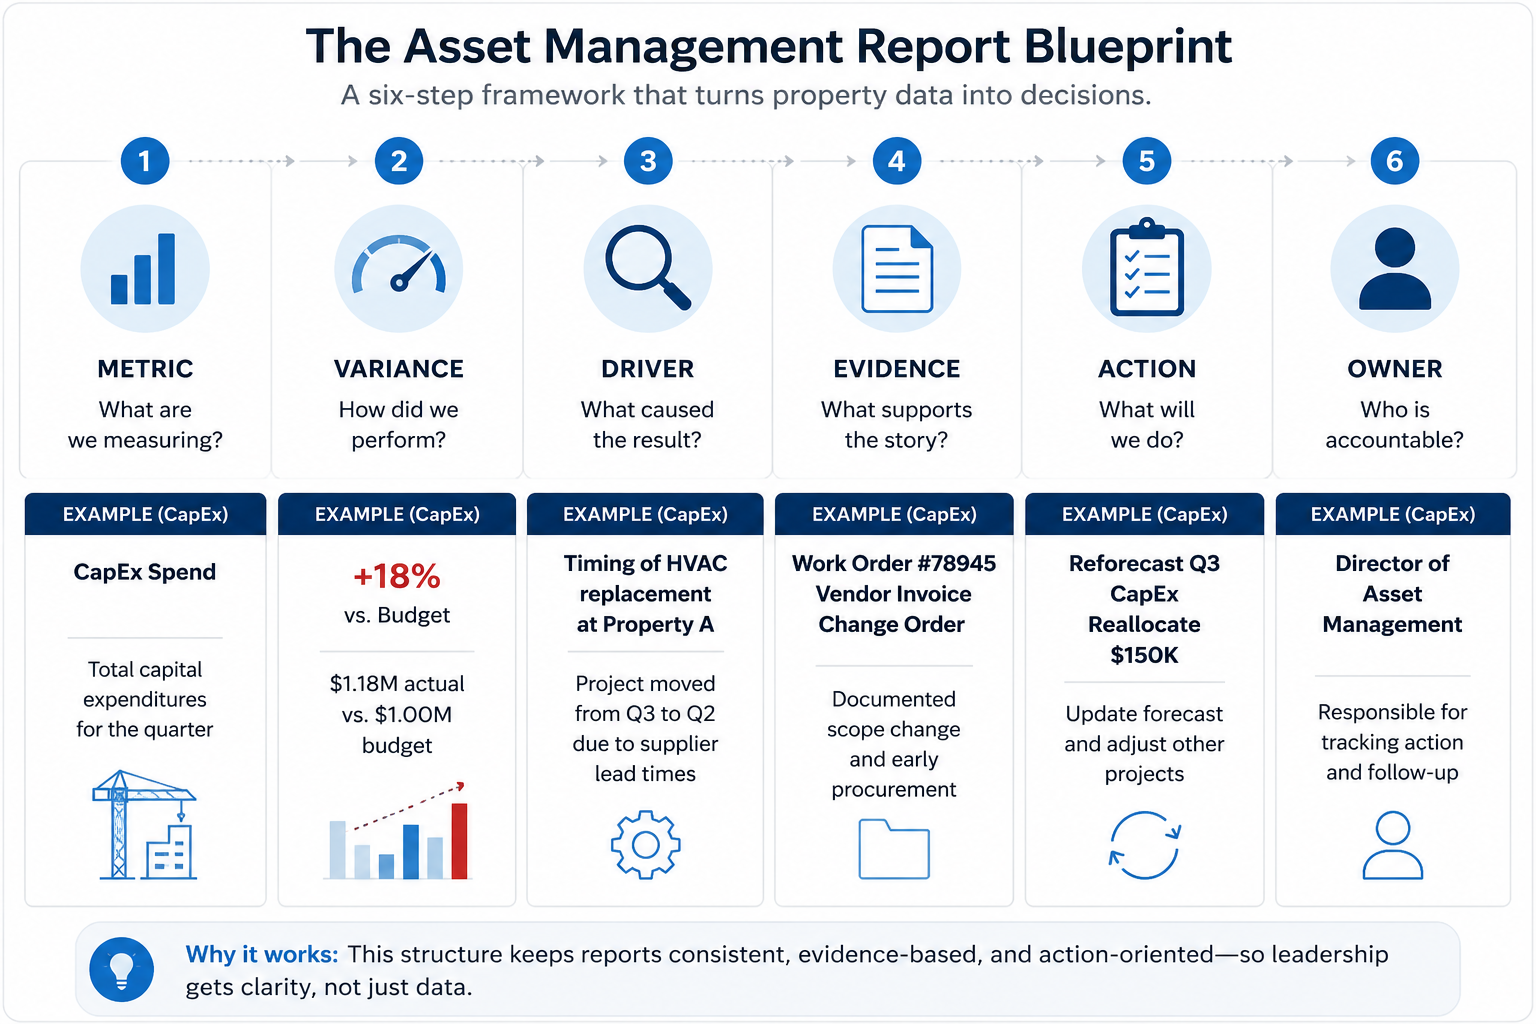
Applied to a real example: producing a quarterly asset-management report for a single industrial property.
- Query: What changed at this property this quarter, and why?
- Verify: Confirm the rent roll and GL figures tie out to the reporting close date before drafting begins.
- Explain: Occupancy dropped 6 percentage points after a tenant vacated at lease expiration; operating expenses were flat.
- Structure: Organize into the asset-management report's standard sections — occupancy summary, financial performance, leasing pipeline, capital plan update.
- Format: Populate the firm's existing quarterly template, including its standard chart types and property photo placement.
- Review: The asset manager checks the draft against source data and adjusts the leasing pipeline commentary before approving it.
- Version: The approved draft is saved as v3, distinct from the two earlier working drafts, with a clear record of what changed between them.
- Publish: The final version goes to the investment committee distribution list ahead of the scheduled meeting.
Skipping steps is where the pipeline breaks down in practice — usually by jumping straight from Query to Format, which produces a polished-looking report built on an unverified number.
Where AI reporting falls short
AI reporting shortens the distance between a verified answer and a finished document. It does not remove every source of risk in the reporting process, and naming the specific limits matters more than a generic disclaimer.
Fully autonomous investor reporting is not a realistic promise, and any workflow claiming otherwise should be treated with skepticism. Materiality judgment — deciding what's significant enough to call out, how to characterize a disappointing quarter, and what legal or compliance language a disclosure requires — is a human responsibility that doesn't transfer to an AI system regardless of how good the drafting gets.
Template fidelity requires ongoing maintenance, not a one-time setup. When a firm updates its brand guidelines or its investor template changes, the reporting workflow has to be updated to match, or every subsequent report drifts further from the approved format. Confident-sounding narrative can outrun the data underneath it: an AI-drafted commentary paragraph can read as authoritative even when the source figures are stale, incomplete, or pending reconciliation, which makes the review stage non-negotiable rather than optional. Version proliferation is a real risk introduced by making drafts faster to produce: if a team doesn't enforce a single canonical version discipline, faster drafting can produce more conflicting copies to reconcile, not fewer.
Bring analysis into the final deliverable
Move from cited data answers to polished, reviewable reports without losing context.
Talk to BayaanHow to evaluate an AI reporting workflow before you rely on it
Before routing investor or board-facing reports through an AI-assisted workflow, a reporting team should confirm a short set of prerequisites rather than assuming speed alone proves the workflow is ready.
- Confirm every number entering the reporting layer already carries a source citation from a governed data answer, not a manually pasted figure.
- Test template fidelity against the firm's actual current template, not a generic layout, before trusting the output for anything external.
- Define explicitly who signs off on a report before it leaves the building, and make sure that step cannot be skipped.
- Establish a single canonical versioning system so "final" always means one specific file, not whichever draft someone last emailed.
- Pilot the workflow on an internal-only report for a full cycle before using it for anything investor- or lender-facing.
- Confirm citations and source links survive the format conversion into PowerPoint, Excel, and Word, not just the original conversational answer.